\n
## Line Chart: Answer Accuracy vs. Layer for Llama Models
### Overview
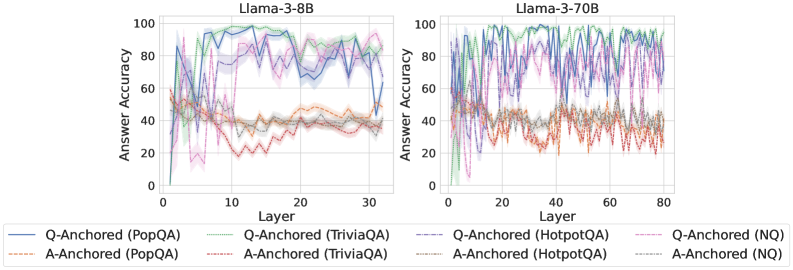
The image presents two line charts comparing the answer accuracy of two Llama models (Llama-3-8B and Llama-3-70B) across different layers. The x-axis represents the layer number, and the y-axis represents the answer accuracy, ranging from 0 to 100. Each chart displays multiple lines, each representing a different question-answering dataset and anchoring method.
### Components/Axes
* **X-axis:** Layer (ranging from approximately 0 to 30 for Llama-3-8B and 0 to 80 for Llama-3-70B).
* **Y-axis:** Answer Accuracy (ranging from 0 to 100).
* **Left Chart Title:** Llama-3-8B
* **Right Chart Title:** Llama-3-70B
* **Legend:**
* Q-Anchored (PopQA) - Blue line
* A-Anchored (PopQA) - Light Brown line
* Q-Anchored (TriviaQA) - Purple line
* A-Anchored (TriviaQA) - Light Purple line
* Q-Anchored (HotpotQA) - Green line
* A-Anchored (HotpotQA) - Light Green line
* Q-Anchored (NQ) - Red line
* A-Anchored (NQ) - Orange line
### Detailed Analysis or Content Details
**Llama-3-8B Chart (Left):**
* **Q-Anchored (PopQA):** The blue line starts at approximately 10, rises sharply to around 90 by layer 5, then fluctuates between 60 and 90 for the remainder of the layers, ending at approximately 85.
* **A-Anchored (PopQA):** The light brown line starts at approximately 10, rises to around 40 by layer 5, and remains relatively stable between 30 and 50 for the rest of the layers, ending at approximately 40.
* **Q-Anchored (TriviaQA):** The purple line starts at approximately 10, rises to around 80 by layer 5, and fluctuates between 60 and 90 for the remainder of the layers, ending at approximately 75.
* **A-Anchored (TriviaQA):** The light purple line starts at approximately 10, rises to around 40 by layer 5, and remains relatively stable between 30 and 50 for the rest of the layers, ending at approximately 40.
* **Q-Anchored (HotpotQA):** The green line starts at approximately 10, rises to around 85 by layer 5, and fluctuates between 60 and 90 for the remainder of the layers, ending at approximately 80.
* **A-Anchored (HotpotQA):** The light green line starts at approximately 10, rises to around 40 by layer 5, and remains relatively stable between 30 and 50 for the rest of the layers, ending at approximately 40.
* **Q-Anchored (NQ):** The red line starts at approximately 10, rises to around 60 by layer 5, and fluctuates between 40 and 70 for the remainder of the layers, ending at approximately 60.
* **A-Anchored (NQ):** The orange line starts at approximately 10, rises to around 40 by layer 5, and remains relatively stable between 30 and 50 for the rest of the layers, ending at approximately 40.
**Llama-3-70B Chart (Right):**
* **Q-Anchored (PopQA):** The blue line starts at approximately 10, rises sharply to around 90 by layer 5, then fluctuates between 60 and 90 for the remainder of the layers, ending at approximately 80.
* **A-Anchored (PopQA):** The light brown line starts at approximately 10, rises to around 40 by layer 5, and remains relatively stable between 30 and 50 for the rest of the layers, ending at approximately 40.
* **Q-Anchored (TriviaQA):** The purple line starts at approximately 10, rises to around 80 by layer 5, and fluctuates between 60 and 90 for the remainder of the layers, ending at approximately 75.
* **A-Anchored (TriviaQA):** The light purple line starts at approximately 10, rises to around 40 by layer 5, and remains relatively stable between 30 and 50 for the rest of the layers, ending at approximately 40.
* **Q-Anchored (HotpotQA):** The green line starts at approximately 10, rises to around 85 by layer 5, and fluctuates between 60 and 90 for the remainder of the layers, ending at approximately 80.
* **A-Anchored (HotpotQA):** The light green line starts at approximately 10, rises to around 40 by layer 5, and remains relatively stable between 30 and 50 for the rest of the layers, ending at approximately 40.
* **Q-Anchored (NQ):** The red line starts at approximately 10, rises to around 60 by layer 5, and fluctuates between 40 and 70 for the remainder of the layers, ending at approximately 60.
* **A-Anchored (NQ):** The orange line starts at approximately 10, rises to around 40 by layer 5, and remains relatively stable between 30 and 50 for the rest of the layers, ending at approximately 40.
### Key Observations
* For both models, the "Q-Anchored" lines consistently exhibit higher answer accuracy than the corresponding "A-Anchored" lines across all datasets.
* The answer accuracy generally increases rapidly in the initial layers (up to layer 5) for all datasets and anchoring methods.
* After the initial increase, the answer accuracy tends to plateau and fluctuate, suggesting diminishing returns from adding more layers.
* The 70B model shows similar trends to the 8B model, but extends to a larger number of layers (80 vs 30).
* PopQA, TriviaQA, and HotpotQA datasets generally achieve higher accuracy than the NQ dataset.
### Interpretation
The data suggests that question-anchored methods consistently outperform answer-anchored methods in terms of answer accuracy for both Llama models. This indicates that focusing on the question during the learning process is more effective than focusing on the answer. The initial rapid increase in accuracy with the first few layers suggests that the early layers are crucial for capturing fundamental knowledge. The plateauing of accuracy after a certain number of layers indicates that adding more layers may not significantly improve performance, and could potentially lead to overfitting. The differences in accuracy between datasets may reflect the complexity and quality of the datasets themselves. The 70B model's extended layer range allows for potentially more nuanced learning, but the overall trends remain consistent with the 8B model. This data is valuable for understanding the strengths and weaknesses of different training strategies and for optimizing the architecture of Llama models.