## Line Charts: Llama-3 Model Answer Accuracy by Layer
### Overview
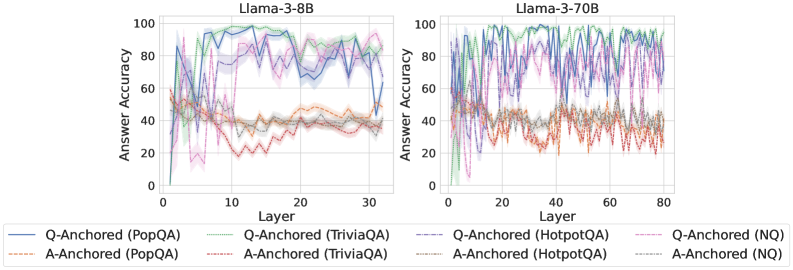
The image displays two side-by-side line charts comparing the "Answer Accuracy" across network layers for two different-sized language models: Llama-3-8B (left) and Llama-3-70B (right). Each chart plots the performance of eight different experimental conditions, defined by an anchoring method (Q-Anchored or A-Anchored) applied to four different question-answering datasets.
### Components/Axes
* **Chart Titles:** "Llama-3-8B" (left chart), "Llama-3-70B" (right chart).
* **Y-Axis (Both Charts):** Label: "Answer Accuracy". Scale: 0 to 100, with major tick marks at intervals of 20 (0, 20, 40, 60, 80, 100).
* **X-Axis (Left Chart - Llama-3-8B):** Label: "Layer". Scale: 0 to 30, with major tick marks at 0, 10, 20, 30.
* **X-Axis (Right Chart - Llama-3-70B):** Label: "Layer". Scale: 0 to 80, with major tick marks at 0, 20, 40, 60, 80.
* **Legend (Bottom, spanning both charts):** Contains 8 entries, differentiating lines by color and style (solid vs. dashed).
* **Solid Lines (Q-Anchored):**
* Blue: Q-Anchored (PopQA)
* Green: Q-Anchored (TriviaQA)
* Purple: Q-Anchored (HotpotQA)
* Pink: Q-Anchored (NQ)
* **Dashed Lines (A-Anchored):**
* Orange: A-Anchored (PopQA)
* Red: A-Anchored (TriviaQA)
* Gray: A-Anchored (HotpotQA)
* Light Blue: A-Anchored (NQ)
### Detailed Analysis
**Llama-3-8B Chart (Left):**
* **Q-Anchored Lines (Solid):** All four lines show a rapid initial rise from layer 0, reaching a high plateau (approximately 70-100% accuracy) by layer 5-10. They maintain this high performance with moderate fluctuations across the remaining layers (10-30). The Green (TriviaQA) and Pink (NQ) lines appear to be the highest and most stable, often near 90-100%. The Blue (PopQA) and Purple (HotpotQA) lines are slightly lower and more volatile, with a notable dip for Blue around layer 25.
* **A-Anchored Lines (Dashed):** These lines perform significantly worse. They start low, rise to a modest peak between layers 5-15 (approximately 40-60% accuracy), and then generally decline or stagnate at a lower level (20-50%) for the remaining layers. The Red (TriviaQA) line shows the most pronounced decline after its early peak. The Orange (PopQA), Gray (HotpotQA), and Light Blue (NQ) lines cluster together in the 30-50% range for most layers.
**Llama-3-70B Chart (Right):**
* **Q-Anchored Lines (Solid):** Similar to the 8B model, these lines rise quickly to a high accuracy band (approximately 70-100%). However, the performance is much more volatile, with frequent, sharp peaks and troughs across all layers (0-80). Despite the noise, the Green (TriviaQA) and Pink (NQ) lines again appear to be the strongest performers. The Purple (HotpotQA) line shows extreme volatility, with deep drops below 60%.
* **A-Anchored Lines (Dashed):** These lines also show higher volatility compared to their 8B counterparts. They occupy a lower accuracy band, mostly between 20-60%. There is no clear upward trend after the initial layers; instead, they fluctuate within this range. The Red (TriviaQA) line is particularly low and volatile, often dipping near 20%.
### Key Observations
1. **Anchoring Method Dominance:** The most striking pattern is the clear and consistent separation between Q-Anchored (solid lines) and A-Anchored (dashed lines) performance across both models and all datasets. Q-Anchored methods yield substantially higher answer accuracy.
2. **Model Size and Volatility:** The larger Llama-3-70B model exhibits significantly greater layer-to-layer volatility in accuracy for both anchoring methods compared to the more stable Llama-3-8B.
3. **Dataset Hierarchy:** Within the Q-Anchored group, performance on TriviaQA (Green) and NQ (Pink) tends to be highest and most stable, followed by PopQA (Blue) and HotpotQA (Purple).
4. **Early Layer Behavior:** Both models show a critical phase in the first 5-10 layers where accuracy for Q-Anchored methods rapidly ascends to its operational plateau.
5. **A-Anchored Plateau/Decline:** A-Anchored methods in the 8B model show an early peak followed by a decline, suggesting later layers may be less optimized for this representation. In the 70B model, they simply fluctuate at a low level.
### Interpretation
The data strongly suggests that the **anchoring method is a far more critical factor for final answer accuracy than the specific layer within the network** (for layers beyond the initial few). Representations anchored to the question (Q-Anchored) are consistently and significantly more effective for extracting accurate answers than those anchored to the answer (A-Anchored) across diverse datasets.
The increased volatility in the 70B model could indicate more specialized or "opinionated" layers, where individual layers have stronger, more variable effects on the final output. This might be a characteristic of larger models with greater capacity. The consistent performance hierarchy among datasets (TriviaQA/NQ > PopQA/HotpotQA) for Q-Anchored methods may reflect intrinsic differences in dataset difficulty or how well the model's pre-training aligns with the knowledge required for each.
**Notable Anomaly:** The sharp, deep dip in the Q-Anchored (HotpotQA - Purple) line in the Llama-3-70B chart around layer 50 is an outlier. This could represent a layer that is particularly detrimental to performance on multi-hop reasoning tasks (which HotpotQA tests), or it could be an artifact of the specific experimental run.