\n
## Stacked Bar Chart: Task Distribution Across Agent Behaviors
### Overview
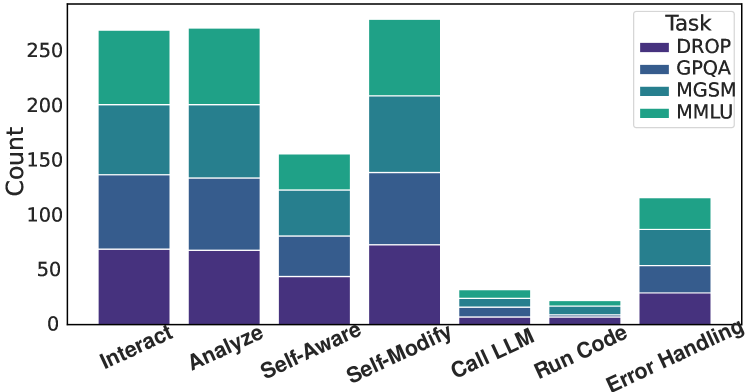
This is a stacked bar chart visualizing the distribution of four different tasks (DROP, GPQA, MGSM, and MMLU) across seven agent behaviors: Interact, Analyze, Self-Aware, Self-Modify, Call LLM, Run Code, and Error Handling. The y-axis represents the count, while the x-axis represents the agent behaviors. Each bar is segmented to show the contribution of each task to that behavior.
### Components/Axes
* **X-axis:** Agent Behaviors - Interact, Analyze, Self-Aware, Self-Modify, Call LLM, Run Code, Error Handling.
* **Y-axis:** Count - Scale ranges from 0 to 250, with increments of 50.
* **Legend:** Task - DROP (Dark Blue), GPQA (Medium Blue), MGSM (Light Blue), MMLU (Green). The legend is positioned in the top-right corner of the chart.
### Detailed Analysis
Let's analyze each agent behavior and the task distribution within it:
* **Interact:** The bar is approximately 275 units high. It is composed of:
* DROP: ~75
* GPQA: ~100
* MGSM: ~75
* MMLU: ~25
* **Analyze:** The bar is approximately 275 units high. It is composed of:
* DROP: ~75
* GPQA: ~100
* MGSM: ~50
* MMLU: ~50
* **Self-Aware:** The bar is approximately 150 units high. It is composed of:
* DROP: ~50
* GPQA: ~50
* MGSM: ~25
* MMLU: ~25
* **Self-Modify:** The bar is approximately 275 units high. It is composed of:
* DROP: ~100
* GPQA: ~75
* MGSM: ~50
* MMLU: ~50
* **Call LLM:** The bar is approximately 50 units high. It is composed of:
* DROP: ~25
* GPQA: ~25
* MGSM: ~0
* MMLU: ~0
* **Run Code:** The bar is approximately 25 units high. It is composed of:
* DROP: ~0
* GPQA: ~0
* MGSM: ~25
* MMLU: ~0
* **Error Handling:** The bar is approximately 100 units high. It is composed of:
* DROP: ~25
* GPQA: ~25
* MGSM: ~25
* MMLU: ~25
### Key Observations
* The "Interact" and "Self-Modify" behaviors have the highest overall counts, indicating they are the most frequently observed behaviors.
* DROP and GPQA consistently contribute the most to the counts across most behaviors.
* MGSM and MMLU have relatively lower counts compared to DROP and GPQA.
* "Call LLM" and "Run Code" have significantly lower counts than other behaviors, suggesting they are less common.
* "Run Code" is almost exclusively associated with MGSM.
### Interpretation
The chart demonstrates the distribution of different tasks across various agent behaviors. The dominance of "Interact" and "Self-Modify" suggests these are core behaviors exhibited by the agents. The consistent presence of DROP and GPQA across behaviors indicates these tasks are fundamental to the agent's operation. The low counts for "Call LLM" and "Run Code" might suggest these behaviors are either less frequently required or less effectively implemented by the agents. The specialization of "Run Code" with MGSM could indicate that this task is particularly relevant or suited for MGSM. The relatively even distribution of tasks within "Error Handling" suggests that errors are encountered across all task types. This data could be used to identify areas for improvement in agent behavior and task allocation.