\n
## Stacked Bar Chart: Task Counts by Category
### Overview
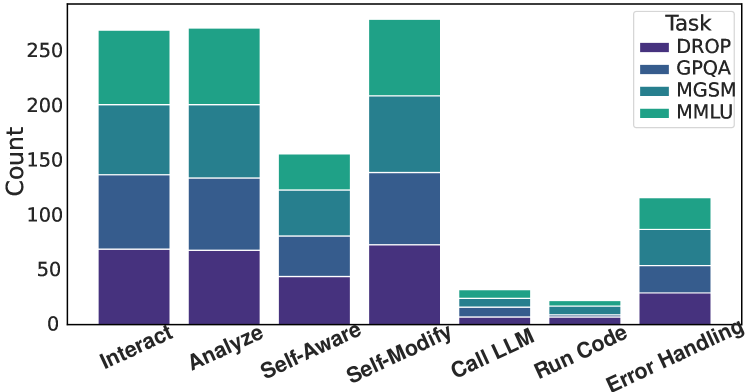
The image displays a stacked bar chart titled "Task" in the legend, illustrating the distribution of counts across seven distinct tasks, each broken down into four categories: DROP, GPQA, MGSM, and MMLU. The chart compares the total volume and composition of these tasks.
### Components/Axes
* **X-Axis (Tasks):** Seven categorical labels are present, rotated at a 45-degree angle for readability. From left to right: `Interact`, `Analyze`, `Self-Aware`, `Self-Modify`, `Call LLM`, `Run Code`, `Error Handling`.
* **Y-Axis (Count):** A linear numerical scale labeled "Count" ranging from 0 to 250, with major tick marks at intervals of 50 (0, 50, 100, 150, 200, 250).
* **Legend:** Positioned in the top-right corner of the chart area. It defines the color coding for the four stacked categories:
* **DROP:** Dark purple (bottom segment of each bar).
* **GPQA:** Medium blue (second segment from the bottom).
* **MGSM:** Teal (third segment from the bottom).
* **MMLU:** Green (top segment of each bar).
### Detailed Analysis
The following table reconstructs the approximate count for each category within every task. Values are estimated from the bar heights and segment sizes, with inherent visual uncertainty.
| Task | DROP (Purple) | GPQA (Blue) | MGSM (Teal) | MMLU (Green) | **Approx. Total** |
| :--- | :--- | :--- | :--- | :--- | :--- |
| **Interact** | ~70 | ~65 | ~65 | ~70 | **~270** |
| **Analyze** | ~70 | ~65 | ~65 | ~70 | **~270** |
| **Self-Aware** | ~45 | ~35 | ~40 | ~35 | **~155** |
| **Self-Modify** | ~75 | ~65 | ~70 | ~70 | **~280** |
| **Call LLM** | ~10 | ~10 | ~5 | ~5 | **~30** |
| **Run Code** | ~8 | ~7 | ~5 | ~5 | **~25** |
| **Error Handling** | ~30 | ~25 | ~30 | ~30 | **~115** |
**Trend Verification:**
* **DROP (Purple):** Forms the base of each bar. Its height is relatively consistent for `Interact`, `Analyze`, and `Self-Modify` (~70-75), lower for `Self-Aware` (~45) and `Error Handling` (~30), and very low for `Call LLM` and `Run Code` (~8-10).
* **GPQA (Blue):** Sits directly above DROP. Its segment size is fairly uniform across the first four tasks (~35-65) and `Error Handling` (~25), but minimal for `Call LLM` and `Run Code`.
* **MGSM (Teal):** The third segment. It is a significant component of `Interact`, `Analyze`, `Self-Modify`, and `Error Handling` (~30-70), moderate in `Self-Aware` (~40), and very small in `Call LLM` and `Run Code`.
* **MMLU (Green):** The top segment. It is a major contributor to the tall bars (`Interact`, `Analyze`, `Self-Modify` at ~70), a moderate part of `Self-Aware` and `Error Handling` (~30-35), and a minor part of `Call LLM` and `Run Code`.
### Key Observations
1. **Task Volume Disparity:** There is a stark contrast in total counts. `Self-Modify`, `Interact`, and `Analyze` are the highest-volume tasks (all ~270-280). `Self-Aware` and `Error Handling` are mid-volume (~115-155). `Call LLM` and `Run Code` are the lowest-volume tasks by a significant margin (~25-30).
2. **Compositional Similarity:** The three highest-volume tasks (`Interact`, `Analyze`, `Self-Modify`) have remarkably similar internal compositions, with each of the four categories (DROP, GPQA, MGSM, MMLU) contributing roughly equal, large portions.
3. **Low-Volume Task Profile:** The two lowest-volume tasks (`Call LLM`, `Run Code`) are not only small in total but are also dominated by the DROP and GPQA categories, with minimal contribution from MGSM and MMLU.
4. **`Error Handling` Composition:** While its total is moderate, `Error Handling` shows a more balanced distribution across all four categories compared to the other low/mid-volume tasks.
### Interpretation
This chart likely visualizes the frequency or occurrence of different types of operations or challenges within a system (possibly an AI agent or model evaluation framework). The data suggests:
* **Core vs. Peripheral Functions:** `Interact`, `Analyze`, and `Self-Modify` appear to be core, high-frequency activities that uniformly engage all four measured dimensions (DROP, GPQA, MGSM, MMLU). This could indicate these tasks are complex and multifaceted.
* **Specialized, Low-Frequency Operations:** `Call LLM` and `Run Code` are rare events. Their composition, skewed towards DROP and GPQA, might imply they are more specialized or lower-level functions that don't trigger the MGSM and MMLU dimensions as often.
* **Nature of `Self-Aware`:** This task has a distinct profile—lower total volume than the top three but a composition that still includes all categories. This could represent a reflective or meta-cognitive process that is less frequent than direct interaction/analysis but still comprehensive.
* **Robustness Indicator:** The `Error Handling` task, with its balanced distribution across categories, suggests that error conditions are diverse and can arise from or relate to all four underlying dimensions of the system.
**In essence, the chart reveals a system where a few complex, high-engagement tasks dominate the workload, while more specific, technical operations occur much less frequently. The uniform composition of the major tasks implies they are the primary drivers of activity across all measured metrics.**