## Line Chart: Steps to Reach the Goal vs. Training Steps
### Overview
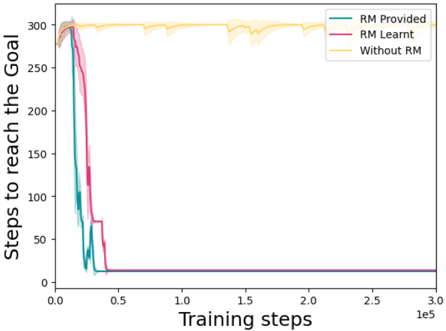
The image is a line chart comparing the number of steps required to reach a goal during a training process, across three different conditions: "RM Provided," "RM Learnt," and "Without RM." The x-axis represents training steps, and the y-axis represents the number of steps to reach the goal.
### Components/Axes
* **X-axis:** "Training steps" with a scale from 0 to 3.0 x 10^5 (300,000). Axis markers are present at 0.0, 0.5, 1.0, 1.5, 2.0, 2.5, and 3.0 (x 10^5).
* **Y-axis:** "Steps to reach the Goal" with a scale from 0 to 300. Axis markers are present at 0, 50, 100, 150, 200, 250, and 300.
* **Legend:** Located in the top-right corner.
* "RM Provided" - Teal line
* "RM Learnt" - Pink/Magenta line
* "Without RM" - Yellow line
### Detailed Analysis
* **RM Provided (Teal):**
* Trend: Starts high (around 290 steps), rapidly decreases to approximately 15 steps by 0.5 x 10^5 training steps, and then remains relatively constant.
* Data Points:
* 0 training steps: ~290 steps
* 0.1 x 10^5 training steps: ~75 steps
* 0.2 x 10^5 training steps: ~20 steps
* 0.5 x 10^5 training steps: ~15 steps
* 3.0 x 10^5 training steps: ~13 steps
* **RM Learnt (Pink/Magenta):**
* Trend: Starts high (around 300 steps), decreases to approximately 15 steps by 0.5 x 10^5 training steps, and then remains relatively constant.
* Data Points:
* 0 training steps: ~300 steps
* 0.1 x 10^5 training steps: ~150 steps
* 0.2 x 10^5 training steps: ~70 steps
* 0.4 x 10^5 training steps: ~15 steps
* 3.0 x 10^5 training steps: ~13 steps
* **Without RM (Yellow):**
* Trend: Starts around 290 steps and remains relatively constant around 300 steps throughout the training process, with some minor fluctuations.
* Data Points:
* 0 training steps: ~290 steps
* 1.0 x 10^5 training steps: ~300 steps
* 2.0 x 10^5 training steps: ~305 steps
* 3.0 x 10^5 training steps: ~300 steps
### Key Observations
* Both "RM Provided" and "RM Learnt" conditions show a significant decrease in the number of steps required to reach the goal as training progresses, eventually stabilizing at a low number of steps.
* The "Without RM" condition consistently requires a high number of steps to reach the goal throughout the training process.
* The shaded regions around each line likely represent the variance or standard deviation of the data.
### Interpretation
The data suggests that using Reinforcement Management (RM), whether provided or learned, significantly improves the efficiency of reaching the goal during the training process. The "RM Provided" and "RM Learnt" conditions demonstrate a rapid learning curve, quickly reducing the number of steps needed. In contrast, the "Without RM" condition shows no improvement over time, indicating that RM is crucial for efficient goal attainment in this scenario. The similarity in performance between "RM Provided" and "RM Learnt" suggests that the system can effectively learn and utilize RM strategies.