## Line Chart: Training Performance Comparison (Steps to Reach Goal)
### Overview
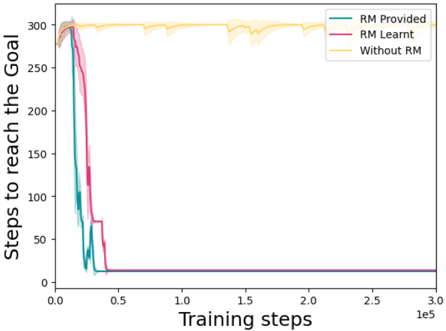
This chart illustrates the performance of three different reinforcement learning configurations over the course of 300,000 training steps. The Y-axis represents the "Steps to reach the goal" (where lower values indicate better performance), and the X-axis represents "Training steps." The chart compares an agent with a "Provided" Reward Model (RM), an agent with a "Learnt" RM, and an agent operating "Without RM."
### Components/Axes
* **Y-Axis:** Labeled "Steps to reach the goal." The scale ranges from 0 to 300.
* **X-Axis:** Labeled "Training steps." The scale ranges from 0 to 3.0e5 (300,000 steps).
* **Legend:** Located in the top-right corner of the chart.
* **Teal Line:** "RM Provided"
* **Magenta Line:** "RM Learnt"
* **Yellow Line:** "Without RM"
* **Visual Elements:** Each line includes a shaded region surrounding it, representing the variance or confidence interval of the data.
### Detailed Analysis
#### 1. "Without RM" (Yellow Line)
* **Trend:** The line begins at approximately 280 steps. Within the first 0.1e5 (10,000) steps, it rises to 300. It remains consistently at 300 steps for the duration of the training (up to 3.0e5 steps).
* **Observations:** There are minor, periodic downward fluctuations (dips) in the yellow line throughout the training, but the agent consistently returns to the 300-step ceiling.
#### 2. "RM Provided" (Teal Line)
* **Trend:** The line starts at approximately 280 steps. It remains relatively stable until roughly 0.1e5 steps, at which point it begins a sharp, steep decline.
* **Convergence:** The line reaches its minimum value of approximately 15 steps by roughly 0.3e5 (30,000) steps. It maintains this performance level (a flat line at ~15 steps) from 0.3e5 through 3.0e5.
* **Uncertainty:** There is a notable shaded region indicating high variance during the initial learning phase (0.1e5 to 0.3e5 steps).
#### 3. "RM Learnt" (Magenta Line)
* **Trend:** The line starts at approximately 280 steps. It remains stable until roughly 0.2e5 steps, at which point it begins a sharp, steep decline.
* **Convergence:** The line reaches its minimum value of approximately 15 steps by roughly 0.4e5 (40,000) steps. It maintains this performance level (a flat line at ~15 steps) from 0.4e5 through 3.0e5.
* **Uncertainty:** Similar to the "RM Provided" line, there is a significant shaded region indicating high variance during the learning phase (0.2e5 to 0.4e5 steps).
### Key Observations
* **Performance Gap:** The "Without RM" configuration fails to learn the task, remaining at the maximum step count (300) throughout the entire training period.
* **Learning Efficiency:** The "RM Provided" configuration converges faster than the "RM Learnt" configuration. The "RM Provided" agent begins its descent at ~0.1e5 steps, whereas the "RM Learnt" agent begins its descent at ~0.2e5 steps.
* **Final Proficiency:** Both the "RM Provided" and "RM Learnt" configurations achieve identical final performance levels, converging to approximately 15 steps to reach the goal.
### Interpretation
The data strongly suggests that the presence of a Reward Model (RM) is a prerequisite for the agent to successfully learn the task.
* **Without RM:** The agent is likely unable to distinguish between beneficial and detrimental actions, resulting in a failure to reach the goal efficiently (or at all, given the 300-step cap).
* **RM Provided vs. Learnt:** The "RM Provided" agent has a "head start" because it does not need to spend training time developing an internal representation of the reward function. The "RM Learnt" agent eventually catches up to the same level of proficiency, demonstrating that the agent is capable of learning the reward function effectively, albeit with a slight delay in training convergence.
* **Conclusion:** Both RM methods are highly effective, but providing the reward model directly offers a clear efficiency advantage in the early stages of training.