\n
## Line Chart: Steps to Reach the Goal vs. Training Steps
### Overview
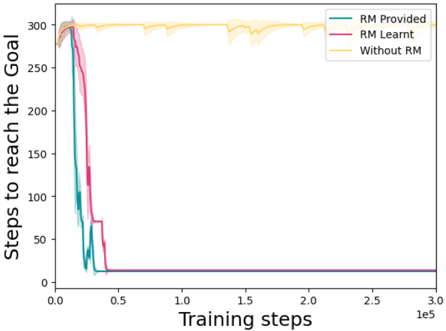
This image presents a line chart illustrating the relationship between "Training steps" (x-axis) and "Steps to reach the goal" (y-axis) under three different conditions: "RM Provided", "RM Learnt", and "Without RM". The chart appears to demonstrate the learning progress of a system or algorithm, showing how the number of steps required to achieve a goal decreases with increasing training.
### Components/Axes
* **X-axis:** "Training steps", ranging from 0 to 300,000 (3.0e5). The scale is linear.
* **Y-axis:** "Steps to reach the goal", ranging from 0 to 300. The scale is linear.
* **Legend:** Located in the top-right corner, identifying three data series:
* "RM Provided" (Blue line)
* "RM Learnt" (Magenta/Purple line)
* "Without RM" (Yellow line)
* **Data Series:** Three lines representing the performance under different conditions. Each line is accompanied by a shaded region, likely representing a standard deviation or confidence interval.
### Detailed Analysis
Let's analyze each line individually:
1. **RM Provided (Blue Line):**
* Trend: The line initially slopes steeply downward, indicating a rapid decrease in steps to reach the goal. It reaches a plateau around 10-20 steps at approximately 50,000 training steps. The line remains relatively flat for the remainder of the training period.
* Data Points (approximate):
* Training Steps = 0, Steps to Goal = ~300
* Training Steps = 50,000, Steps to Goal = ~10-20
* Training Steps = 300,000, Steps to Goal = ~10-20
2. **RM Learnt (Magenta/Purple Line):**
* Trend: Similar to "RM Provided", this line also shows a steep initial decline. It reaches a plateau around 0-10 steps at approximately 50,000 training steps. The line remains relatively flat for the remainder of the training period.
* Data Points (approximate):
* Training Steps = 0, Steps to Goal = ~300
* Training Steps = 50,000, Steps to Goal = ~0-10
* Training Steps = 300,000, Steps to Goal = ~0-10
3. **Without RM (Yellow Line):**
* Trend: This line exhibits a much slower decline compared to the other two. It remains relatively high throughout the training period, fluctuating around 300 steps. There is a slight downward trend, but it is significantly less pronounced.
* Data Points (approximate):
* Training Steps = 0, Steps to Goal = ~300
* Training Steps = 50,000, Steps to Goal = ~300
* Training Steps = 300,000, Steps to Goal = ~300
The shaded regions around each line indicate variability in the results. The "RM Provided" and "RM Learnt" lines have relatively small shaded regions, suggesting consistent performance. The "Without RM" line has a larger shaded region, indicating greater variability.
### Key Observations
* Both "RM Provided" and "RM Learnt" significantly outperform "Without RM" in terms of reducing the steps to reach the goal.
* The performance of "RM Provided" and "RM Learnt" is nearly identical after approximately 50,000 training steps.
* "Without RM" shows minimal improvement even after 300,000 training steps.
* The shaded regions suggest that the "RM Provided" and "RM Learnt" methods are more stable and reliable than the "Without RM" method.
### Interpretation
The data suggests that the use of "RM" (likely referring to Reward Modeling or Reinforcement Modeling) is crucial for efficient learning. Providing or learning the reward model leads to a rapid decrease in the steps required to achieve the goal, while the absence of a reward model results in significantly slower and less consistent learning. The fact that "RM Provided" and "RM Learnt" converge to similar performance levels indicates that the algorithm is capable of effectively learning the reward model itself, achieving comparable results to having a pre-defined reward model. The large variability in the "Without RM" condition suggests that the learning process is highly sensitive to initial conditions or random factors when a reward model is not used. This chart demonstrates the effectiveness of reward modeling in accelerating and stabilizing the learning process.