## Flowchart: Machine Learning Pipeline Stages
### Overview
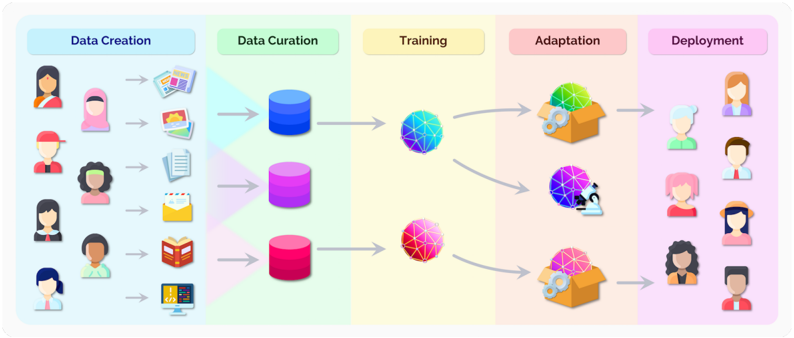
The image depicts a five-stage machine learning pipeline, illustrated with icons and directional arrows. Each stage represents a critical phase in the development and deployment of AI systems, progressing from raw data collection to end-user implementation.
### Components/Axes
1. **Stages (Left to Right)**:
- **Data Creation** (Blue)
- **Data Curation** (Green)
- **Training** (Yellow)
- **Adaptation** (Peach)
- **Deployment** (Purple)
2. **Visual Elements**:
- **Icons**: Represent data types, processing, and human interaction.
- **Arrows**: Indicate sequential flow between stages.
- **Color Coding**: Each stage has a distinct background color for visual separation.
### Detailed Analysis
1. **Data Creation (Blue)**:
- **Icons**: Diverse human silhouettes (gender, ethnicity, age variations) and data symbols (photos, documents, code).
- **Purpose**: Represents collection of raw, diverse data inputs from multiple sources.
2. **Data Curation (Green)**:
- **Icons**: Three stacked cylinders (blue, purple, red) with arrows pointing right.
- **Purpose**: Symbolizes data cleaning, organization, and structuring into usable datasets.
3. **Training (Yellow)**:
- **Icons**: Three neural network spheres (blue, purple, pink) connected by arrows.
- **Purpose**: Illustrates model training on curated data, with iterative refinement.
4. **Adaptation (Peach)**:
- **Icons**: Two open boxes containing neural networks with gears (one with a microscope).
- **Purpose**: Represents model customization, fine-tuning, and domain-specific adjustments.
5. **Deployment (Purple)**:
- **Icons**: Diverse human silhouettes interacting with technology (headphones, laptops).
- **Purpose**: Shows end-user interaction and real-world application of the deployed model.
### Key Observations
- **Sequential Flow**: Arrows strictly follow left-to-right progression, emphasizing linear dependency between stages.
- **Diversity Emphasis**: Repeated use of varied human silhouettes in Data Creation and Deployment stages highlights inclusivity in AI development.
- **Technical Symbolism**: Neural networks, gears, and microscopes visually reinforce technical processes (training, adaptation).
- **No Numerical Data**: The diagram focuses on conceptual flow rather than quantitative metrics.
### Interpretation
This flowchart represents a standardized ML pipeline, emphasizing:
1. **Human-Centric Design**: Diversity in data collection and user interaction stages suggests prioritization of ethical AI development.
2. **Iterative Refinement**: The Training and Adaptation stages show continuous improvement through feedback loops (implied by bidirectional arrows between neural networks).
3. **Technical Complexity**: Use of specialized icons (microscope, gears) indicates advanced customization in later stages.
4. **End-User Focus**: Final stage's human-technology interaction icons stress the importance of usability in deployment.
The diagram serves as a high-level blueprint for AI system development, balancing technical rigor with human considerations. The absence of numerical data suggests it's intended for conceptual understanding rather than performance measurement.