## ROC Curves: Receiver Operating Characteristic Curves
### Overview
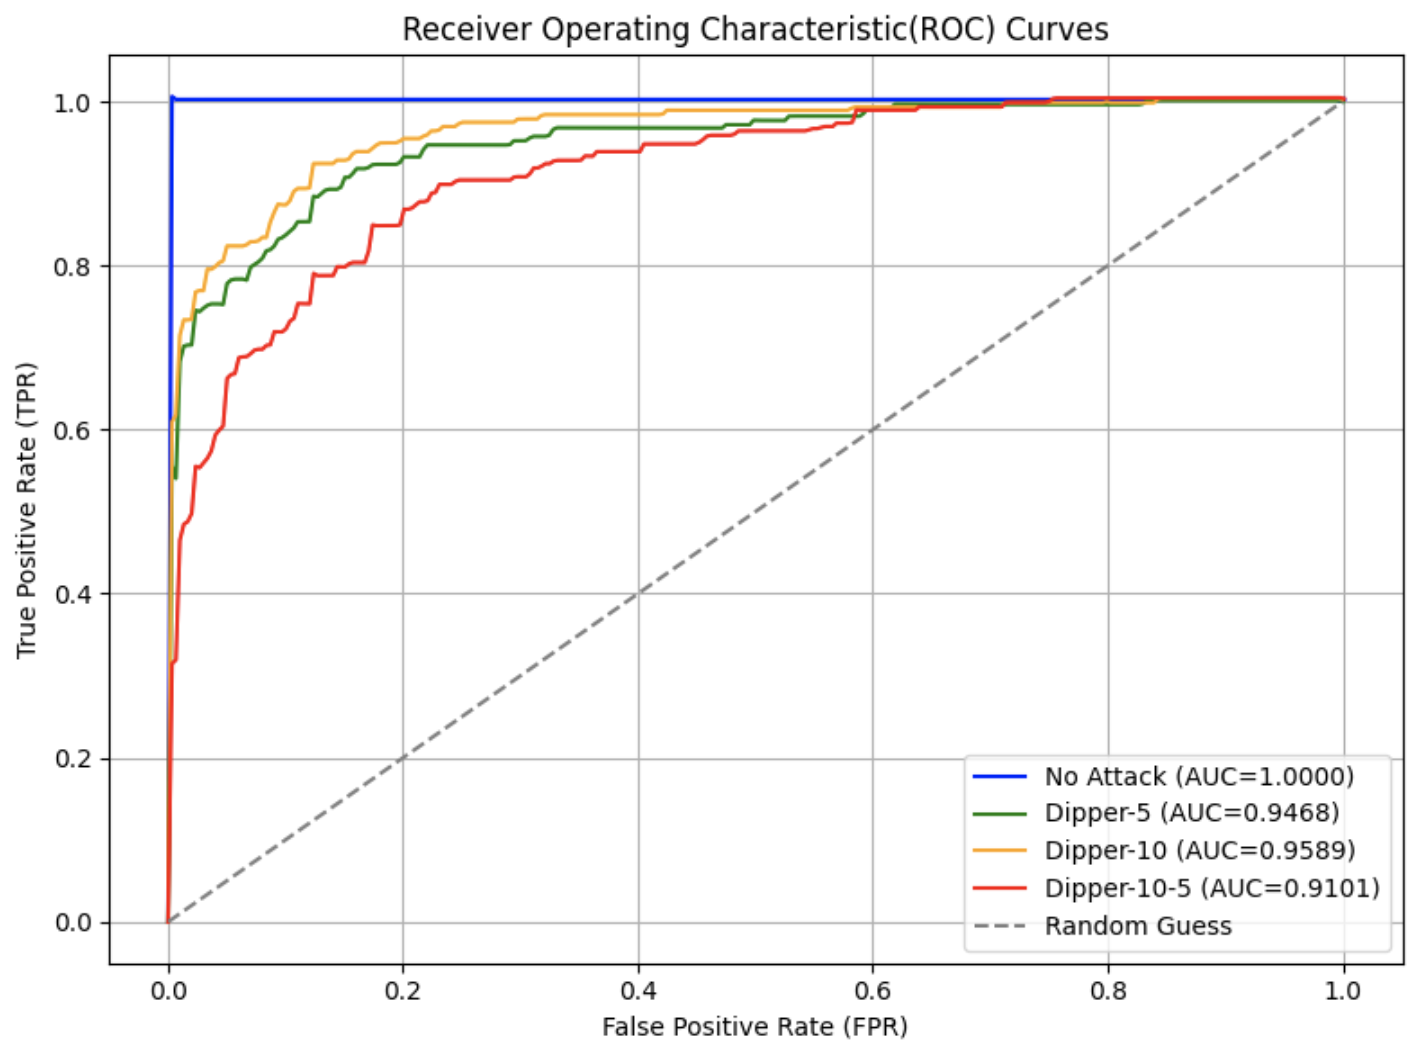
The image displays a Receiver Operating Characteristic (ROC) curve, which visualizes the trade-off between the **True Positive Rate (TPR)** and **False Positive Rate (FPR)** for different classification models. The curves are plotted against a grid with axes ranging from 0.0 to 1.0. A legend identifies five data series, each represented by a distinct color and line style.
### Components/Axes
- **X-axis**: False Positive Rate (FPR) (0.0 to 1.0)
- **Y-axis**: True Positive Rate (TPR) (0.0 to 1.0)
- **Legend**:
- **No Attack** (blue solid line, AUC=1.0000)
- **Dipper-5** (green solid line, AUC=0.9468)
- **Dipper-10** (orange solid line, AUC=0.9589)
- **Dipper-10-5** (red solid line, AUC=0.9101)
- **Random Guess** (gray dashed line)
- **Axis Markers**: Grid lines at 0.0, 0.2, 0.4, 0.6, 0.8, 1.0 for both axes.
### Detailed Analysis
1. **No Attack (Blue Line)**:
- A horizontal line at TPR=1.0 across all FPR values.
- Indicates perfect classification with no false positives.
- AUC=1.0000 (ideal performance).
2. **Random Guess (Gray Dashed Line)**:
- A diagonal line from (0,0) to (1,1).
- Represents a baseline for random classification.
3. **Dipper-5 (Green Line)**:
- Starts at (0,0) and curves upward to the left, reaching TPR≈0.95 at FPR≈0.1.
- AUC=0.9468.
4. **Dipper-10 (Orange Line)**:
- Starts at (0,0) and curves upward to the left, reaching TPR≈0.98 at FPR≈0.05.
- AUC=0.9589 (best among the Dipper models).
5. **Dipper-10-5 (Red Line)**:
- Starts at (0,0) and curves upward to the left, reaching TPR≈0.92 at FPR≈0.15.
- AUC=0.9101 (lowest among the Dipper models).
### Key Observations
- The **No Attack** model achieves perfect performance (AUC=1.0000), suggesting it is optimized for scenarios without attacks.
- **Dipper-10** outperforms other models (AUC=0.9589), indicating superior discrimination between attack and non-attack cases.
- **Dipper-10-5** has the lowest AUC (0.9101), suggesting it is less effective than the other models.
- All models (except Random Guess) outperform the baseline (Random Guess line).
### Interpretation
The ROC curves demonstrate the effectiveness of different models in distinguishing between attack and non-attack scenarios. The **No Attack** model’s perfect performance implies it is tailored for a specific context (e.g., no attacks in the dataset). Among the Dipper models, **Dipper-10** achieves the highest AUC, indicating it balances TPR and FPR most effectively. The **Dipper-10-5** model’s lower AUC suggests it may have suboptimal threshold settings or design choices. The **Random Guess** line serves as a critical benchmark, confirming that all models perform better than random chance.
The curves highlight the importance of model selection and threshold tuning in classification tasks, particularly in security or anomaly detection applications where minimizing false positives is critical.