## Chart Type: Receiver Operating Characteristic (ROC) Curves
### Overview
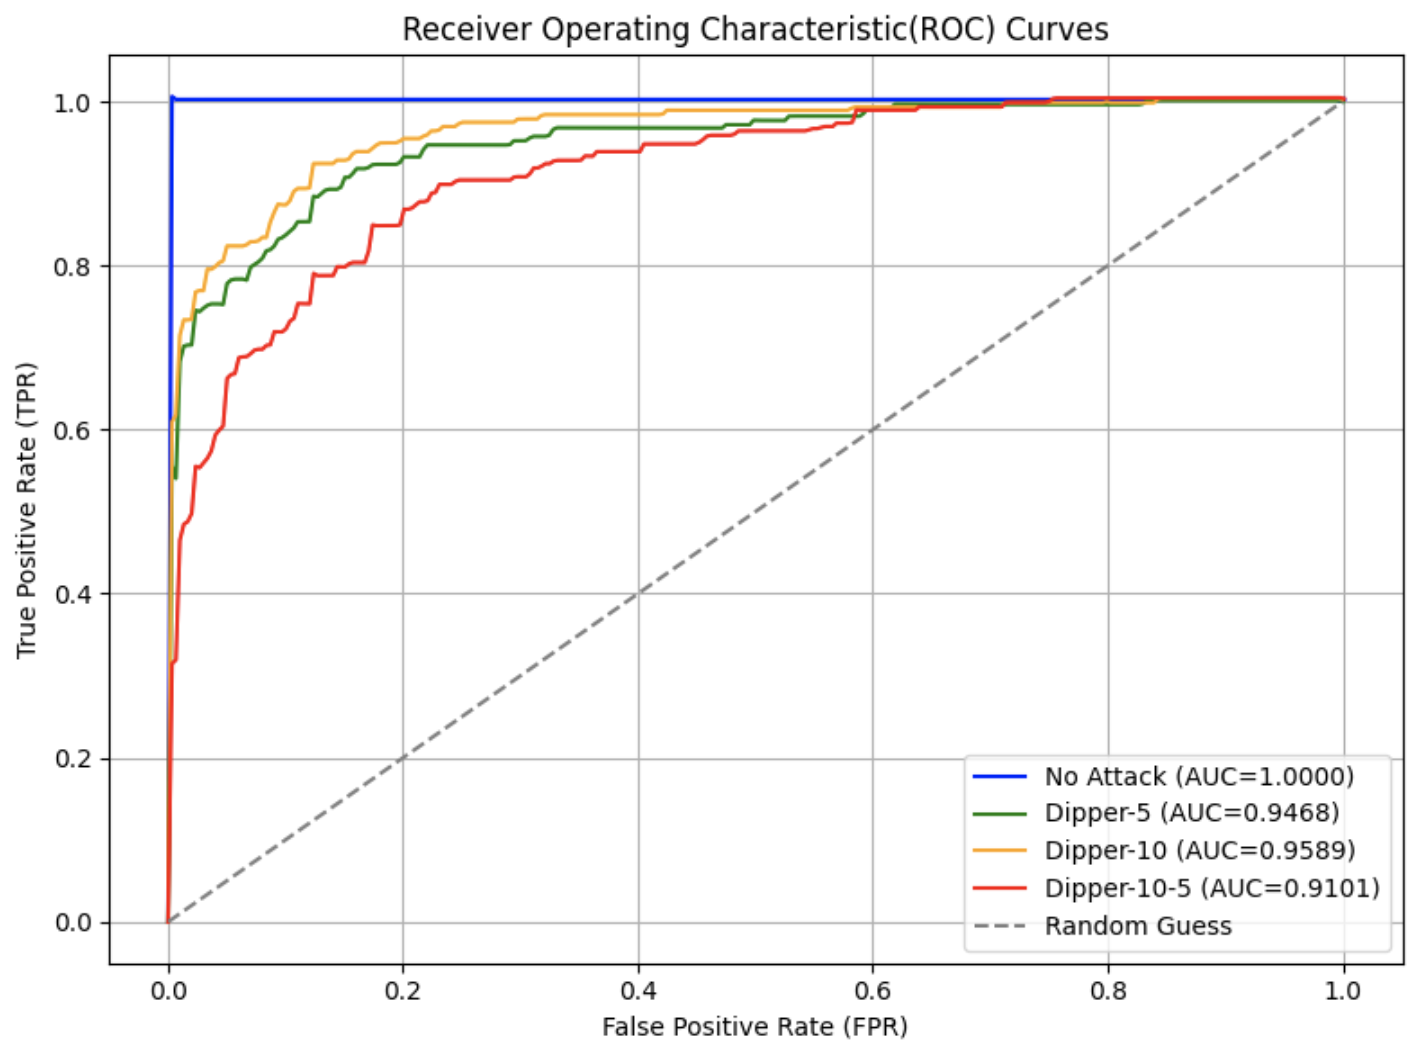
The image is a Receiver Operating Characteristic (ROC) curve plot, comparing the performance of different attack scenarios (Dipper-5, Dipper-10, Dipper-10-5) against a "No Attack" baseline and a "Random Guess" baseline. The plot shows the True Positive Rate (TPR) against the False Positive Rate (FPR) for each scenario. The Area Under the Curve (AUC) is provided for each scenario in the legend.
### Components/Axes
* **Title:** Receiver Operating Characteristic (ROC) Curves
* **X-axis:** False Positive Rate (FPR), ranging from 0.0 to 1.0 in increments of 0.2.
* **Y-axis:** True Positive Rate (TPR), ranging from 0.0 to 1.0 in increments of 0.2.
* **Grid:** The plot has a grid for easier reading of values.
* **Legend:** Located in the bottom-right corner, the legend identifies each curve by attack scenario and its corresponding AUC value.
* Blue: No Attack (AUC=1.0000)
* Green: Dipper-5 (AUC=0.9468)
* Orange: Dipper-10 (AUC=0.9589)
* Red: Dipper-10-5 (AUC=0.9101)
* Dashed Gray: Random Guess
### Detailed Analysis
* **No Attack (Blue):** The blue line representing "No Attack" rises vertically to a TPR of 1.0 at an FPR of approximately 0.0, and then remains at 1.0 for all FPR values.
* **Dipper-5 (Green):** The green line representing "Dipper-5" rises sharply initially, then gradually increases to a TPR of approximately 0.98 at an FPR of approximately 0.6.
* **Dipper-10 (Orange):** The orange line representing "Dipper-10" rises sharply initially, then gradually increases to a TPR of approximately 0.99 at an FPR of approximately 0.6.
* **Dipper-10-5 (Red):** The red line representing "Dipper-10-5" rises less sharply than the other attack scenarios, reaching a TPR of approximately 0.95 at an FPR of approximately 0.6.
* **Random Guess (Dashed Gray):** The dashed gray line representing "Random Guess" is a diagonal line from (0.0, 0.0) to (1.0, 1.0).
### Key Observations
* The "No Attack" scenario has a perfect AUC of 1.0000, indicating perfect classification.
* The "Dipper-10" scenario has the highest AUC among the attack scenarios (0.9589), followed by "Dipper-5" (0.9468) and "Dipper-10-5" (0.9101).
* All attack scenarios perform significantly better than the "Random Guess" baseline.
* The ROC curves for the attack scenarios are clustered relatively close together, suggesting similar performance characteristics.
### Interpretation
The ROC curves illustrate the performance of different attack scenarios in terms of their ability to correctly classify events (True Positives) while minimizing false alarms (False Positives). The "No Attack" scenario represents an ideal case where there are no false positives and all true positives are correctly identified. The attack scenarios show varying degrees of performance, with "Dipper-10" performing the best among them. The AUC values provide a quantitative measure of the overall performance of each scenario, with higher AUC values indicating better performance. The "Random Guess" baseline represents the performance of a classifier that makes random predictions, providing a lower bound for comparison. The closer the ROC curve is to the top-left corner, the better the performance of the classifier.