## Diagram: Drug Retrosynthesis vs. Propositional Logic
### Overview
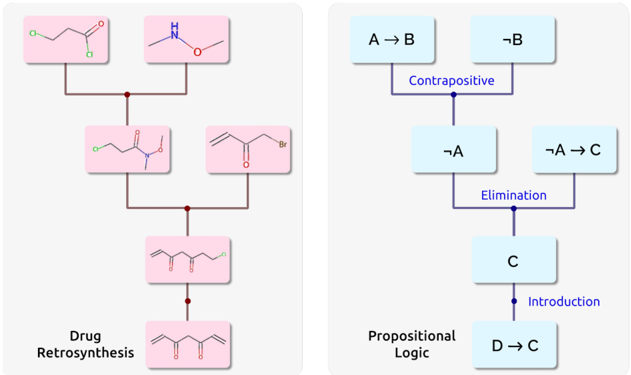
The image presents two diagrams side-by-side. The left diagram illustrates a drug retrosynthesis pathway, showing the breakdown of a complex molecule into simpler precursors. The right diagram depicts a propositional logic derivation, demonstrating logical inference steps.
### Components/Axes
**Left Diagram: Drug Retrosynthesis**
* **Nodes:** Rectangular boxes containing chemical structures. These represent molecules at different stages of the retrosynthetic process. The boxes are light pink.
* **Edges:** Brown lines connecting the nodes, indicating the retrosynthetic transformations.
* **Text Label:** "Drug Retrosynthesis" is located at the bottom-left of the diagram.
**Right Diagram: Propositional Logic**
* **Nodes:** Rectangular boxes containing logical statements. These represent propositions or implications. The boxes are light blue.
* **Edges:** Blue lines connecting the nodes, indicating logical inference rules.
* **Text Labels:** "Propositional Logic" is located at the bottom-left of the diagram.
* **Inference Rule Labels:** "Contrapositive", "Elimination", "Introduction" are written in blue along the edges.
### Detailed Analysis
**Left Diagram: Drug Retrosynthesis**
1. **Top Level:**
* Left Box: Chemical structure with two chlorine atoms (Cl) and a carbonyl group (C=O).
* Right Box: Chemical structure containing nitrogen (N) and oxygen (O) atoms.
2. **Intermediate Level 1:**
* Left Box: Chemical structure with one chlorine atom (Cl), a carbonyl group (C=O), nitrogen (N) and oxygen (O) atoms.
* Right Box: Chemical structure with a bromine atom (Br) and a carbonyl group (C=O).
3. **Intermediate Level 2:**
* Box: Chemical structure with one chlorine atom (Cl) and two carbonyl groups (C=O).
4. **Bottom Level:**
* Box: Chemical structure with two carbonyl groups (C=O).
**Right Diagram: Propositional Logic**
1. **Top Level:**
* Left Box: "A → B" (A implies B)
* Right Box: "¬B" (Not B)
* Edge Label: "Contrapositive"
2. **Intermediate Level 1:**
* Left Box: "¬A" (Not A)
* Right Box: "¬A → C" (Not A implies C)
* Edge Label: "Elimination"
3. **Intermediate Level 2:**
* Box: "C"
* Edge Label: "Introduction"
4. **Bottom Level:**
* Box: "D → C" (D implies C)
### Key Observations
* The Drug Retrosynthesis diagram shows a breakdown of a complex molecule into simpler components, moving from top to bottom.
* The Propositional Logic diagram demonstrates logical inference, also moving from top to bottom.
* Both diagrams use a hierarchical structure to represent the steps in their respective processes.
### Interpretation
The image draws a parallel between drug retrosynthesis and propositional logic. Both processes involve breaking down a complex entity (a molecule or a logical statement) into simpler components or steps. The retrosynthesis diagram illustrates how a medicinal chemist might plan the synthesis of a drug by working backward from the target molecule to simpler, commercially available starting materials. The propositional logic diagram demonstrates how logical conclusions can be derived from initial premises using inference rules. The analogy highlights the structured and systematic nature of both disciplines.