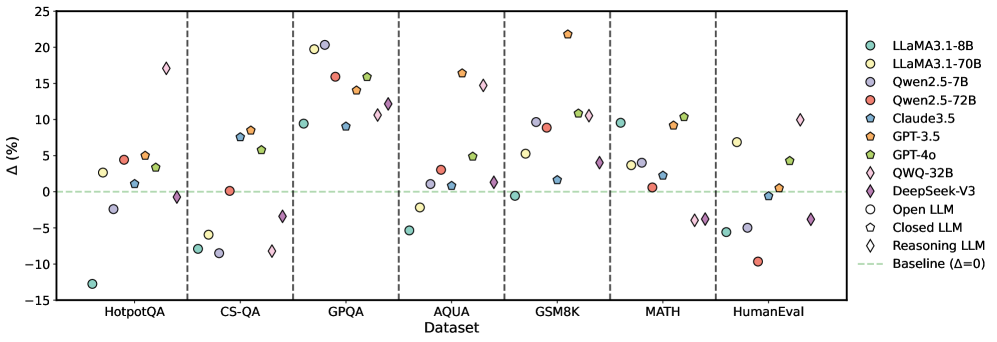
## Scatter Plot: Model Performance Across Datasets
### Overview
The image is a scatter plot comparing the performance of various large language models (LLMs) across seven datasets. The y-axis represents percentage change (Δ%) relative to a baseline (Δ=0), while the x-axis lists datasets: HotpotQA, CS-QA, GPQA, AQUA, GSM8K, MATH, and HumanEval. Data points are color-coded and shaped by model type, with a legend on the right.
### Components/Axes
- **X-axis (Dataset)**: Categorical labels for seven datasets (HotpotQA, CS-QA, GPQA, AQUA, GSM8K, MATH, HumanEval).
- **Y-axis (Δ%)**: Numerical scale from -15% to 25%, with a dashed green baseline at 0%.
- **Legend**: 12 models represented by colors and markers:
- **Cyan circles**: LLaMA 3.1-8B
- **Yellow circles**: LLaMA 3.1-70B
- **Red circles**: Qwen 2.5-72B
- **Blue circles**: Claude 3.5
- **Orange circles**: GPT-3.5
- **Green circles**: GPT-4o
- **Pink diamonds**: QWQ-32B
- **Purple diamonds**: DeepSeek-V3
- **White circles**: Open LLM
- **Gray circles**: Closed LLM
- **Pink diamonds**: Reasoning LLM
### Detailed Analysis
- **HotpotQA**:
- LLaMA 3.1-70B (yellow) shows the highest Δ (~18%), while Claude 3.5 (blue) has the lowest (~-15%).
- GPT-4o (green) and DeepSeek-V3 (purple) cluster near 0%.
- **CS-QA**:
- GPT-4o (green) peaks at ~12%, while LLaMA 3.1-8B (cyan) dips to ~-8%.
- Qwen 2.5-72B (red) and Reasoning LLM (pink) show moderate gains (~5-7%).
- **GPQA**:
- LLaMA 3.1-70B (yellow) and GPT-4o (green) exceed 15%, while Open LLM (white) and Closed LLM (gray) cluster near 0%.
- **AQUA**:
- GPT-4o (green) and DeepSeek-V3 (purple) show ~10-12% gains, while LLaMA 3.1-8B (cyan) dips to ~-5%.
- **GSM8K**:
- GPT-4o (green) peaks at ~22%, with LLaMA 3.1-70B (yellow) at ~10%.
- Claude 3.5 (blue) and Open LLM (white) show minimal gains (~2-3%).
- **MATH**:
- GPT-4o (green) and DeepSeek-V3 (purple) exceed 10%, while LLaMA 3.1-8B (cyan) and Qwen 2.5-72B (red) cluster near 0%.
- **HumanEval**:
- GPT-4o (green) and DeepSeek-V3 (purple) show ~5-7% gains, while LLaMA 3.1-8B (cyan) and Qwen 2.5-72B (red) dip below 0%.
### Key Observations
1. **GPT-4o (green circles)** consistently outperforms other models across most datasets, with the highest Δ in GSM8K (~22%).
2. **LLaMA 3.1-70B (yellow circles)** shows strong performance in GPQA and AQUA but underperforms in HumanEval.
3. **Claude 3.5 (blue circles)** and **Qwen 2.5-72B (red circles)** exhibit mixed results, with notable dips in HotpotQA and MATH.
4. **Reasoning LLM (pink diamonds)** and **DeepSeek-V3 (purple diamonds)** demonstrate competitive performance, particularly in GSM8K and MATH.
5. **Open LLM (white circles)** and **Closed LLM (gray circles)** generally cluster near the baseline (Δ=0), indicating minimal improvement.
### Interpretation
The data suggests that **GPT-4o** and **DeepSeek-V3** are the most robust models across diverse tasks, with GPT-4o excelling in GSM8K and MATH. LLaMA 3.1-70B performs well in specialized domains (GPQA, AQUA) but struggles with reasoning-heavy tasks like HumanEval. Models like **Claude 3.5** and **Qwen 2.5-72B** show inconsistent results, highlighting potential limitations in generalization. The baseline (Δ=0) serves as a critical reference, emphasizing that many models fail to outperform a neutral benchmark in certain datasets. This variability underscores the importance of dataset-specific model selection in real-world applications.