\n
## Scatter Plot: Performance Comparison of LLMs Across Datasets
### Overview
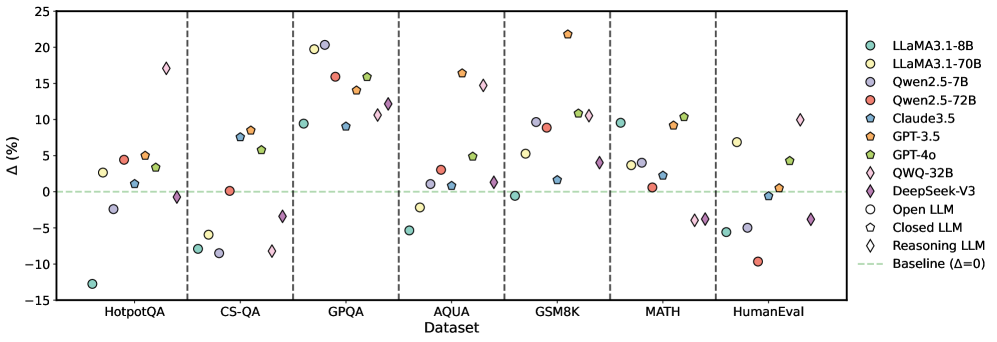
This scatter plot compares the performance of various Large Language Models (LLMs) across seven different datasets. The y-axis represents the performance difference (Δ) in percentage points relative to a baseline. The x-axis represents the dataset name. Each LLM is represented by a unique marker and color. A horizontal dashed line at Δ=0 indicates the baseline performance.
### Components/Axes
* **X-axis:** Dataset - with markers for HotpotQA, CS-QA, GPQA, AQUA, GSM8K, MATH, and HumanEval.
* **Y-axis:** Δ (%) - Performance difference in percentage points. Scale ranges from approximately -15% to 25%.
* **Legend:** Located in the top-right corner, listing the LLMs and their corresponding marker styles and colors:
* Llama3.1-8B (Light Green Circle)
* Llama3.1-70B (Light Blue Circle)
* Qwen2.5-7B (Orange Circle)
* Qwen2.5-72B (Red Circle)
* Claude3.5 (Teal Triangle)
* GPT-3.5 (Dark Orange Diamond)
* GPT-4 (Yellow Diamond)
* QWQ-32B (Purple Diamond)
* DeepSeek-v3 (Magenta Diamond)
* Open LLM (White Circle)
* Closed LLM (Light Gray Triangle)
* Reasoning LLM (Light Gray Diamond)
* Baseline (Δ=0) (Horizontal Dashed Line)
### Detailed Analysis
The plot shows the performance variation of each LLM across the datasets. The following approximate data points are extracted, noting the inherent uncertainty in reading values from a visual plot:
* **HotpotQA:**
* Llama3.1-8B: ~-2%
* Llama3.1-70B: ~2%
* Qwen2.5-7B: ~-5%
* Qwen2.5-72B: ~-1%
* Claude3.5: ~-2%
* GPT-3.5: ~-10%
* GPT-4: ~10%
* QWQ-32B: ~5%
* DeepSeek-v3: ~-10%
* Open LLM: ~-12%
* Closed LLM: ~-1%
* Reasoning LLM: ~-14%
* **CS-QA:**
* Llama3.1-8B: ~5%
* Llama3.1-70B: ~10%
* Qwen2.5-7B: ~2%
* Qwen2.5-72B: ~8%
* Claude3.5: ~8%
* GPT-3.5: ~-2%
* GPT-4: ~15%
* QWQ-32B: ~10%
* DeepSeek-v3: ~5%
* Open LLM: ~-5%
* Closed LLM: ~-2%
* Reasoning LLM: ~-8%
* **GPQA:**
* Llama3.1-8B: ~10%
* Llama3.1-70B: ~18%
* Qwen2.5-7B: ~5%
* Qwen2.5-72B: ~10%
* Claude3.5: ~5%
* GPT-3.5: ~5%
* GPT-4: ~10%
* QWQ-32B: ~10%
* DeepSeek-v3: ~10%
* Open LLM: ~5%
* Closed LLM: ~5%
* Reasoning LLM: ~10%
* **AQUA:**
* Llama3.1-8B: ~5%
* Llama3.1-70B: ~10%
* Qwen2.5-7B: ~2%
* Qwen2.5-72B: ~8%
* Claude3.5: ~2%
* GPT-3.5: ~2%
* GPT-4: ~10%
* QWQ-32B: ~10%
* DeepSeek-v3: ~10%
* Open LLM: ~2%
* Closed LLM: ~2%
* Reasoning LLM: ~5%
* **GSM8K:**
* Llama3.1-8B: ~5%
* Llama3.1-70B: ~10%
* Qwen2.5-7B: ~2%
* Qwen2.5-72B: ~8%
* Claude3.5: ~2%
* GPT-3.5: ~2%
* GPT-4: ~10%
* QWQ-32B: ~10%
* DeepSeek-v3: ~10%
* Open LLM: ~2%
* Closed LLM: ~2%
* Reasoning LLM: ~5%
* **MATH:**
* Llama3.1-8B: ~-5%
* Llama3.1-70B: ~5%
* Qwen2.5-7B: ~-2%
* Qwen2.5-72B: ~2%
* Claude3.5: ~-2%
* GPT-3.5: ~-10%
* GPT-4: ~10%
* QWQ-32B: ~5%
* DeepSeek-v3: ~-5%
* Open LLM: ~-10%
* Closed LLM: ~-5%
* Reasoning LLM: ~-10%
* **HumanEval:**
* Llama3.1-8B: ~5%
* Llama3.1-70B: ~10%
* Qwen2.5-7B: ~2%
* Qwen2.5-72B: ~8%
* Claude3.5: ~2%
* GPT-3.5: ~2%
* GPT-4: ~10%
* QWQ-32B: ~10%
* DeepSeek-v3: ~10%
* Open LLM: ~2%
* Closed LLM: ~2%
* Reasoning LLM: ~5%
### Key Observations
* GPT-4 consistently outperforms other models across all datasets, often by a significant margin.
* Llama3.1-70B generally performs better than Llama3.1-8B.
* Qwen2.5-72B generally performs better than Qwen2.5-7B.
* The "Reasoning LLM" consistently underperforms compared to other models, particularly on HotpotQA, MATH, and GSM8K.
* Open LLMs and Closed LLMs show similar performance across most datasets.
* Performance varies significantly across datasets, suggesting that LLM capabilities are not uniform.
### Interpretation
The data suggests that GPT-4 is the most capable LLM among those tested, demonstrating superior performance across a diverse range of tasks. The larger models (e.g., Llama3.1-70B, Qwen2.5-72B) generally exhibit better performance than their smaller counterparts, indicating that model size is a significant factor. The consistent underperformance of the "Reasoning LLM" suggests that its reasoning capabilities are limited compared to other models. The variation in performance across datasets highlights the importance of evaluating LLMs on a variety of benchmarks to obtain a comprehensive understanding of their strengths and weaknesses. The differences between Open and Closed LLMs are minimal, suggesting that access to the model weights does not necessarily dictate performance. The plot provides valuable insights for selecting the most appropriate LLM for a given task and for identifying areas where further research and development are needed.