## Line Chart: Validation Scores for GRPO and MEL on AIME24 Benchmark
### Overview
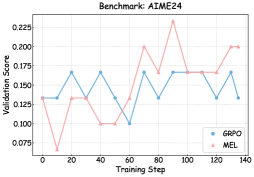
The image is a line chart comparing the validation performance of two methods, **GRPO** (blue line) and **MEL** (red line), across 140 training steps on the AIME24 benchmark. The y-axis represents the validation score (ranging from 0.075 to 0.225), while the x-axis represents training steps (0 to 140). Both lines exhibit fluctuating trends, with **MEL** showing sharper peaks and troughs compared to **GRPO**.
---
### Components/Axes
- **X-axis (Training Step)**: Labeled "Training Step," with markers at intervals of 20 (0, 20, 40, ..., 140).
- **Y-axis (Validation Score)**: Labeled "Validation Score," with increments of 0.025 (0.075, 0.100, ..., 0.225).
- **Legend**: Located at the bottom-right corner, with:
- **Blue line**: Labeled "GRPO"
- **Red line**: Labeled "MEL"
---
### Detailed Analysis
#### GRPO (Blue Line)
- **Initial Phase (Steps 0–40)**:
- Starts at ~0.13, rises to ~0.17 at step 20, then dips to ~0.12 at step 40.
- **Mid-Phase (Steps 60–100)**:
- Peaks at ~0.17 at step 80, dips to ~0.12 at step 100, then stabilizes around ~0.17.
- **Final Phase (Steps 120–140)**:
- Drops to ~0.13 at step 120, then remains flat.
#### MEL (Red Line)
- **Initial Phase (Steps 0–60)**:
- Starts at ~0.13, plunges to ~0.075 at step 10, recovers to ~0.13 at step 60.
- **Mid-Phase (Steps 80–120)**:
- Spikes to ~0.225 at step 90, then stabilizes at ~0.17 until step 120.
- **Final Phase (Steps 120–140)**:
- Rises sharply to ~0.20 at step 130, then plateaus.
---
### Key Observations
1. **MEL's Volatility**:
- MEL exhibits extreme fluctuations, with a dramatic drop to 0.075 at step 10 and a peak of 0.225 at step 90.
2. **GRPO's Stability**:
- GRPO shows moderate oscillations but maintains a narrower range (~0.12–0.17).
3. **Crossing Points**:
- The lines intersect near step 60 (~0.13) and step 100 (~0.17).
4. **Final Performance**:
- By step 140, MEL outperforms GRPO (0.20 vs. 0.13).
---
### Interpretation
- **Performance Trade-offs**:
- MEL achieves higher validation scores in later stages but with significant instability, suggesting potential overfitting or sensitivity to training dynamics.
- GRPO demonstrates robustness but lags in final performance, indicating a conservative learning strategy.
- **Benchmark Insights**:
- The AIME24 benchmark likely tests complex reasoning, where MEL's peaks may reflect breakthroughs in solving harder problems, while GRPO's consistency suggests reliability for simpler tasks.
- **Anomalies**:
- MEL's sharp drop at step 10 could indicate an initial misconfiguration or catastrophic forgetting.
- The final spike in MEL at step 130 might signal a late-stage optimization surge.
This analysis highlights the need to balance exploration (MEL) and exploitation (GRPO) in training strategies for high-stakes benchmarks.