## Line Chart: Validation Score vs. Training Step (Benchmark: AIME24)
### Overview
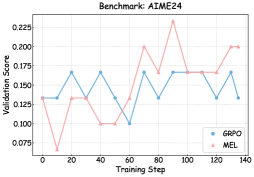
The image presents a line chart illustrating the validation score of two models, GRPO and MEL, against the training step. The chart appears to track the performance of these models during a training process on the AIME24 benchmark.
### Components/Axes
* **Title:** Benchmark: AIME24 (positioned at the top-center)
* **X-axis:** Training Step (ranging from approximately 0 to 140, with gridlines)
* **Y-axis:** Validation Score (ranging from approximately 0.075 to 0.225, with gridlines)
* **Legend:** Located in the bottom-right corner.
* GRPO (represented by a light blue line with circular markers)
* MEL (represented by a light red line with triangular markers)
### Detailed Analysis
**GRPO (Light Blue Line):**
The GRPO line exhibits an oscillating trend. It starts at approximately 0.125 at Training Step 0, increases to a peak of around 0.17 at Training Step 20, dips to approximately 0.13 at Step 40, rises again to around 0.16 at Step 60, then fluctuates between approximately 0.13 and 0.17 until Step 120, and finally ends at approximately 0.16 at Step 140.
* Step 0: ~0.125
* Step 20: ~0.165
* Step 40: ~0.13
* Step 60: ~0.16
* Step 80: ~0.135
* Step 100: ~0.17
* Step 120: ~0.13
* Step 140: ~0.16
**MEL (Light Red Line):**
The MEL line also shows an oscillating pattern, but with a more pronounced peak. It begins at approximately 0.075 at Training Step 0, increases to around 0.13 at Step 20, decreases to a low of approximately 0.10 at Step 40, then experiences a significant rise to a peak of approximately 0.225 at Step 80, before declining to around 0.17 at Step 100, and finally stabilizes around 0.20 at Step 140.
* Step 0: ~0.075
* Step 20: ~0.13
* Step 40: ~0.10
* Step 60: ~0.15
* Step 80: ~0.225
* Step 100: ~0.17
* Step 120: ~0.175
* Step 140: ~0.20
### Key Observations
* The MEL model generally achieves higher validation scores than the GRPO model, especially after Training Step 60.
* Both models exhibit fluctuations in validation score, suggesting that the training process is not consistently improving performance.
* The MEL model shows a significant performance spike around Training Step 80, reaching its highest validation score.
* The GRPO model's performance is more stable, with less dramatic fluctuations.
### Interpretation
The chart demonstrates the training progress of two models (GRPO and MEL) on the AIME24 benchmark. The validation scores indicate how well each model generalizes to unseen data during training. The oscillating nature of the lines suggests that the models are experiencing periods of improvement and regression, potentially due to factors like learning rate, batch size, or the complexity of the data.
The fact that MEL consistently outperforms GRPO suggests that MEL is a more effective model for this particular benchmark, or that it has been trained with more optimal hyperparameters. The peak in MEL's performance at Step 80 could indicate a critical point in the training process where the model learned a significant feature or pattern. The stabilization of both models towards the end of the training process suggests that they are approaching convergence, but further training might not yield substantial improvements.
The differences in the curves suggest that the models have different learning dynamics and sensitivities to the training data. Further investigation into the training process and model architectures could reveal the reasons behind these differences and potentially lead to further performance improvements.