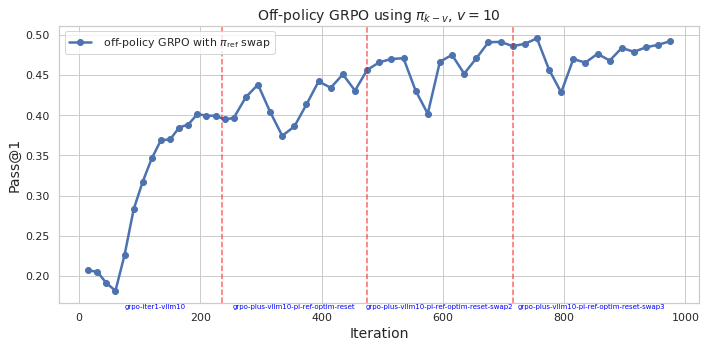
## Line Chart: Off-policy GRPO using πk - v, v = 10
### Overview
The image is a line chart that displays the performance of an "off-policy GRPO" algorithm over a series of iterations. The y-axis represents "Pass@1", a performance metric, and the x-axis represents the "Iteration" number. The chart includes a single data series representing "off-policy GRPO with πref swap". There are also vertical dashed lines indicating specific points where the algorithm was reset or swapped.
### Components/Axes
* **Title:** Off-policy GRPO using πk - v, v = 10
* **X-axis:**
* Label: Iteration
* Scale: 0 to 1000, with major ticks at 0, 200, 400, 600, 800, and 1000.
* Annotations:
* "grpo-iter1-vllm10" at approximately x=100
* "grpo-plus-vllm10-pi-ref-optim-reset" at approximately x=300
* "grpo-plus-vllm10-pi-ref-optim-reset-swap2" at approximately x=700
* "grpo-plus-vllm10-pi-ref-optim-reset-swap3" at approximately x=900
* **Y-axis:**
* Label: Pass@1
* Scale: 0.20 to 0.50, with major ticks at 0.20, 0.25, 0.30, 0.35, 0.40, 0.45, and 0.50.
* **Legend:** Located in the top-left corner.
* "off-policy GRPO with πref swap" (Blue line with circle markers)
* **Vertical Dashed Lines:** Three vertical dashed lines in a light red color are present at approximately x=230, x=580, and x=780.
### Detailed Analysis
* **Off-policy GRPO with πref swap (Blue):**
* Trend: Initially, the line slopes sharply upward from approximately 0.20 at iteration 0 to approximately 0.40 at iteration 200. It then fluctuates between 0.38 and 0.45 until iteration 600. From iteration 600 to 800, it rises to approximately 0.50, then drops to 0.40, and finally rises again to approximately 0.48 by iteration 1000.
* Data Points:
* (0, 0.20)
* (50, 0.32)
* (100, 0.37)
* (200, 0.40)
* (300, 0.37)
* (400, 0.44)
* (500, 0.47)
* (600, 0.40)
* (700, 0.49)
* (800, 0.40)
* (900, 0.47)
* (1000, 0.49)
### Key Observations
* The "off-policy GRPO with πref swap" algorithm shows a significant initial improvement in performance (Pass@1) during the first 200 iterations.
* The algorithm's performance fluctuates after the initial improvement, with some drops and rises.
* The vertical dashed lines appear to correspond to points where the algorithm undergoes some kind of reset or swap operation, potentially impacting its performance.
### Interpretation
The chart illustrates the learning curve of an off-policy GRPO algorithm. The initial rapid increase in "Pass@1" suggests that the algorithm quickly learns effective strategies. The subsequent fluctuations indicate that the algorithm may be sensitive to changes in its environment or parameters. The vertical lines, labeled with "reset" and "swap" operations, likely represent interventions designed to improve or stabilize the algorithm's performance. The overall trend suggests that the algorithm is generally improving over time, but with periods of instability. The labels on the x-axis indicate that the algorithm is being modified with "plus-vllm10-pi-ref-optim" and then reset or swapped.