## Line Chart: Off-policy GRPO Performance
### Overview
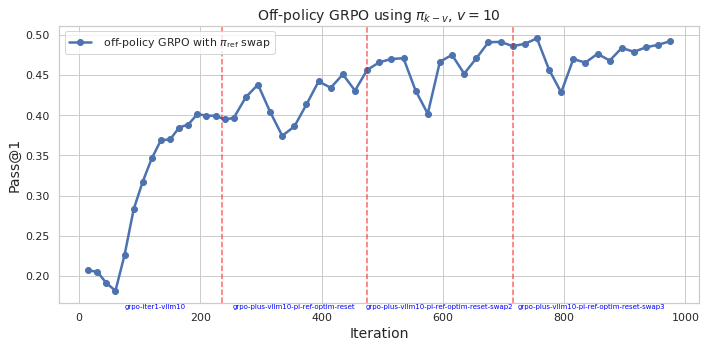
This image presents a line chart illustrating the performance of an off-policy GRPO algorithm using a policy denoted as π<sub>k</sub>-v, with a value of v=10. The chart tracks the Pass@1 metric over iterations, showing how the algorithm's performance evolves during training. Vertical dashed red lines mark specific iteration points with labels indicating algorithm configurations.
### Components/Axes
* **Title:** "Off-policy GRPO using π<sub>k</sub>-v, v = 10" (Top-center)
* **X-axis:** "Iteration" (Bottom-center), ranging from 0 to 1000.
* **Y-axis:** "Pass@1" (Left-center), ranging from 0.20 to 0.50.
* **Data Series:** A single line representing "off-policy GRPO with π<sub>ref</sub> swap" (Top-left legend). The line is blue.
* **Vertical Dashed Lines:** Red dashed lines at approximately iterations 150, 400, 600, 800.
* **Labels on Vertical Dashed Lines:**
* "grpo-iter-v1lm10" (at ~150)
* "grpo-plus-v1lm10-pi-ref-optim-reset" (at ~400)
* "grpo-plus-v1lm10-pi-ref-optim-reset-swap2" (at ~600)
* "grpo-plus-v1lm10-pi-ref-optim-reset-swap3" (at ~800)
### Detailed Analysis
The blue line representing "off-policy GRPO with π<sub>ref</sub> swap" starts at approximately 0.21 at iteration 0. It then exhibits a steep upward trend, reaching around 0.40 by iteration 200. The line fluctuates between approximately 0.40 and 0.48 for the next 400 iterations (from 200 to 600). Around iteration 600, there's a noticeable dip to approximately 0.42, followed by a recovery to around 0.48 by iteration 700. The line then experiences a slight decline, stabilizing around 0.46-0.48 from iteration 800 to 1000.
Here's a breakdown of approximate values at key iterations:
* Iteration 0: ~0.21
* Iteration 50: ~0.24
* Iteration 100: ~0.32
* Iteration 150: ~0.38
* Iteration 200: ~0.40
* Iteration 300: ~0.42
* Iteration 400: ~0.43
* Iteration 500: ~0.46
* Iteration 600: ~0.42
* Iteration 700: ~0.48
* Iteration 800: ~0.47
* Iteration 900: ~0.47
* Iteration 1000: ~0.46
### Key Observations
* The algorithm demonstrates significant initial improvement in Pass@1 within the first 200 iterations.
* Performance plateaus and fluctuates between iterations 200 and 600.
* The configuration changes marked by the red dashed lines appear to correlate with performance shifts, though the relationship isn't strictly monotonic. The dip at iteration 600 coincides with a configuration change.
* The algorithm achieves a peak performance of approximately 0.48 around iteration 700.
* The final performance (at iteration 1000) is slightly lower than the peak, but still significantly higher than the initial performance.
### Interpretation
The chart suggests that the off-policy GRPO algorithm with π<sub>ref</sub> swap is effective in improving the Pass@1 metric, particularly in the early stages of training. The fluctuations in performance after iteration 200 could indicate sensitivity to hyperparameter settings or the exploration-exploitation trade-off. The vertical dashed lines and their associated labels suggest that different algorithm configurations are being tested, and their impact on performance is being monitored. The dip in performance around iteration 600, coinciding with a configuration change, suggests that the new configuration may have temporarily hindered performance before potentially stabilizing. The overall trend indicates that the algorithm converges to a relatively stable performance level, although further optimization might be possible. The Pass@1 metric is a measure of success rate, and the algorithm's ability to reach a Pass@1 of approximately 0.48 indicates a reasonable level of performance. The labels on the vertical lines suggest a systematic exploration of different algorithm variants (e.g., "optim-reset", "swap2", "swap3"), likely aimed at identifying the optimal configuration for maximizing performance.