## Line Chart: Off-policy GRPO using π_k - v, v = 10
### Overview
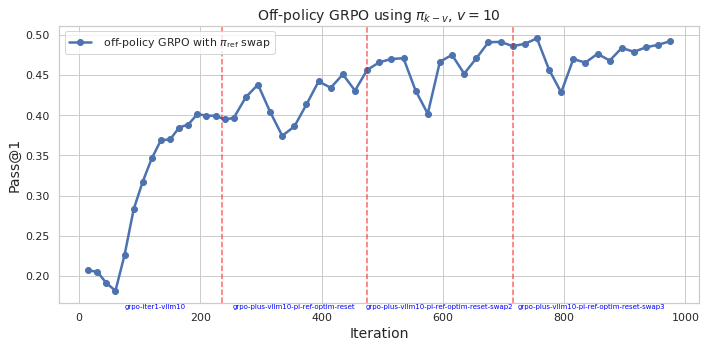
This is a line chart plotting the performance metric "Pass@1" against training "Iteration" for an algorithm labeled "off-policy GRPO with ref swap". The chart shows a generally increasing trend with significant fluctuations, annotated with vertical dashed lines marking specific events or phases in the training process.
### Components/Axes
* **Chart Title:** "Off-policy GRPO using π_k - v, v = 10" (centered at the top).
* **Y-Axis:**
* **Label:** "Pass@1" (rotated vertically on the left).
* **Scale:** Linear, ranging from 0.20 to 0.50.
* **Major Ticks:** 0.20, 0.25, 0.30, 0.35, 0.40, 0.45, 0.50.
* **X-Axis:**
* **Label:** "Iteration" (centered at the bottom).
* **Scale:** Linear, ranging from 0 to 1000.
* **Major Ticks:** 0, 200, 400, 600, 800, 1000.
* **Legend:**
* **Location:** Top-left corner of the plot area.
* **Content:** A blue line with a circle marker labeled "off-policy GRPO with ref swap".
* **Data Series:**
* **Color:** Blue.
* **Marker:** Solid circles at each data point.
* **Line:** Solid blue line connecting the points.
* **Annotations:**
* Four vertical, dashed red lines span the entire height of the plot.
* Each line has a corresponding text label at the bottom, just above the x-axis.
### Detailed Analysis
**Data Series Trend & Key Points:**
The blue line ("off-policy GRPO with ref swap") shows a volatile but overall upward trend in Pass@1 performance over 1000 iterations.
1. **Initial Phase (Iterations 0-~200):** The line starts at approximately 0.205 (Iteration 0). It dips to a local minimum of ~0.18 around Iteration 50, then rises sharply and consistently, reaching ~0.40 by Iteration 200.
2. **Fluctuating Plateau (Iterations ~200-~600):** After the initial rise, the performance enters a phase of high volatility. It fluctuates between approximately 0.37 and 0.47. Notable peaks occur near Iterations 300 (~0.44), 450 (~0.47), and 550 (~0.47). A significant dip occurs around Iteration 580, dropping to ~0.40.
3. **Final Ascent (Iterations ~600-1000):** Following the dip at ~580, the line recovers and trends upward again, though still with fluctuations. It reaches its highest point on the chart, approximately 0.495, near Iteration 950, before ending slightly lower at ~0.49 at Iteration 1000.
**Annotation Labels (from left to right):**
The vertical red dashed lines are positioned at approximately the following iterations, with these exact labels:
1. `grpo-iter1-vlm10` (at ~Iteration 230)
2. `grpo-plus-vlm10-pi-ref-optim-reset` (at ~Iteration 480)
3. `grpo-plus-vlm10-pi-ref-optim-reset-swap2` (at ~Iteration 580)
4. `grpo-plus-vlm10-pi-ref-optim-reset-swap3` (at ~Iteration 720)
### Key Observations
* **Strong Initial Learning:** The most dramatic and consistent improvement occurs in the first 200 iterations.
* **High Volatility Post-Warmup:** After iteration 200, performance becomes highly unstable, with large swings of up to 0.07-0.08 in Pass@1 between consecutive measured points.
* **Correlation with Annotations:** The major performance dip at ~Iteration 580 aligns precisely with the third annotation (`...reset-swap2`). The subsequent recovery and final upward trend begin after this point.
* **Overall Improvement:** Despite the volatility, the final Pass@1 (~0.49) is more than double the starting value (~0.205), indicating successful learning over the full 1000 iterations.
* **No Clear Plateau:** The performance does not appear to have fully converged by Iteration 1000, as the final trend is still upward.
### Interpretation
This chart visualizes the training dynamics of an off-policy Reinforcement Learning from Human Feedback (RLHF) or similar optimization algorithm (GRPO). The "Pass@1" metric likely measures the success rate of a model's single-attempt output.
The data suggests a two-phase training process:
1. **Efficient Early Learning:** The algorithm quickly masters the core task, leading to rapid gains in Pass@1.
2. **Complex Optimization Phase:** The subsequent high volatility indicates the algorithm is navigating a complex loss landscape, possibly due to the "ref swap" mechanism mentioned in the legend. The annotations likely mark interventions like reference model resets or policy swaps, which are common techniques to escape local optima or correct training drift in RLHF. The dip at `...reset-swap2` followed by recovery suggests such an intervention was disruptive in the short term but beneficial for longer-term progress.
The chart demonstrates that while the off-policy GRPO method with reference swapping achieves significant overall improvement, its training path is non-monotonic and requires careful management of optimization events (the annotated resets/swaps) to sustain progress. The final upward trajectory implies the chosen strategy is effective, but the instability highlights the challenge of balancing exploration and stability in this type of training.