## Heatmaps: Attention Weight Visualization
### Overview
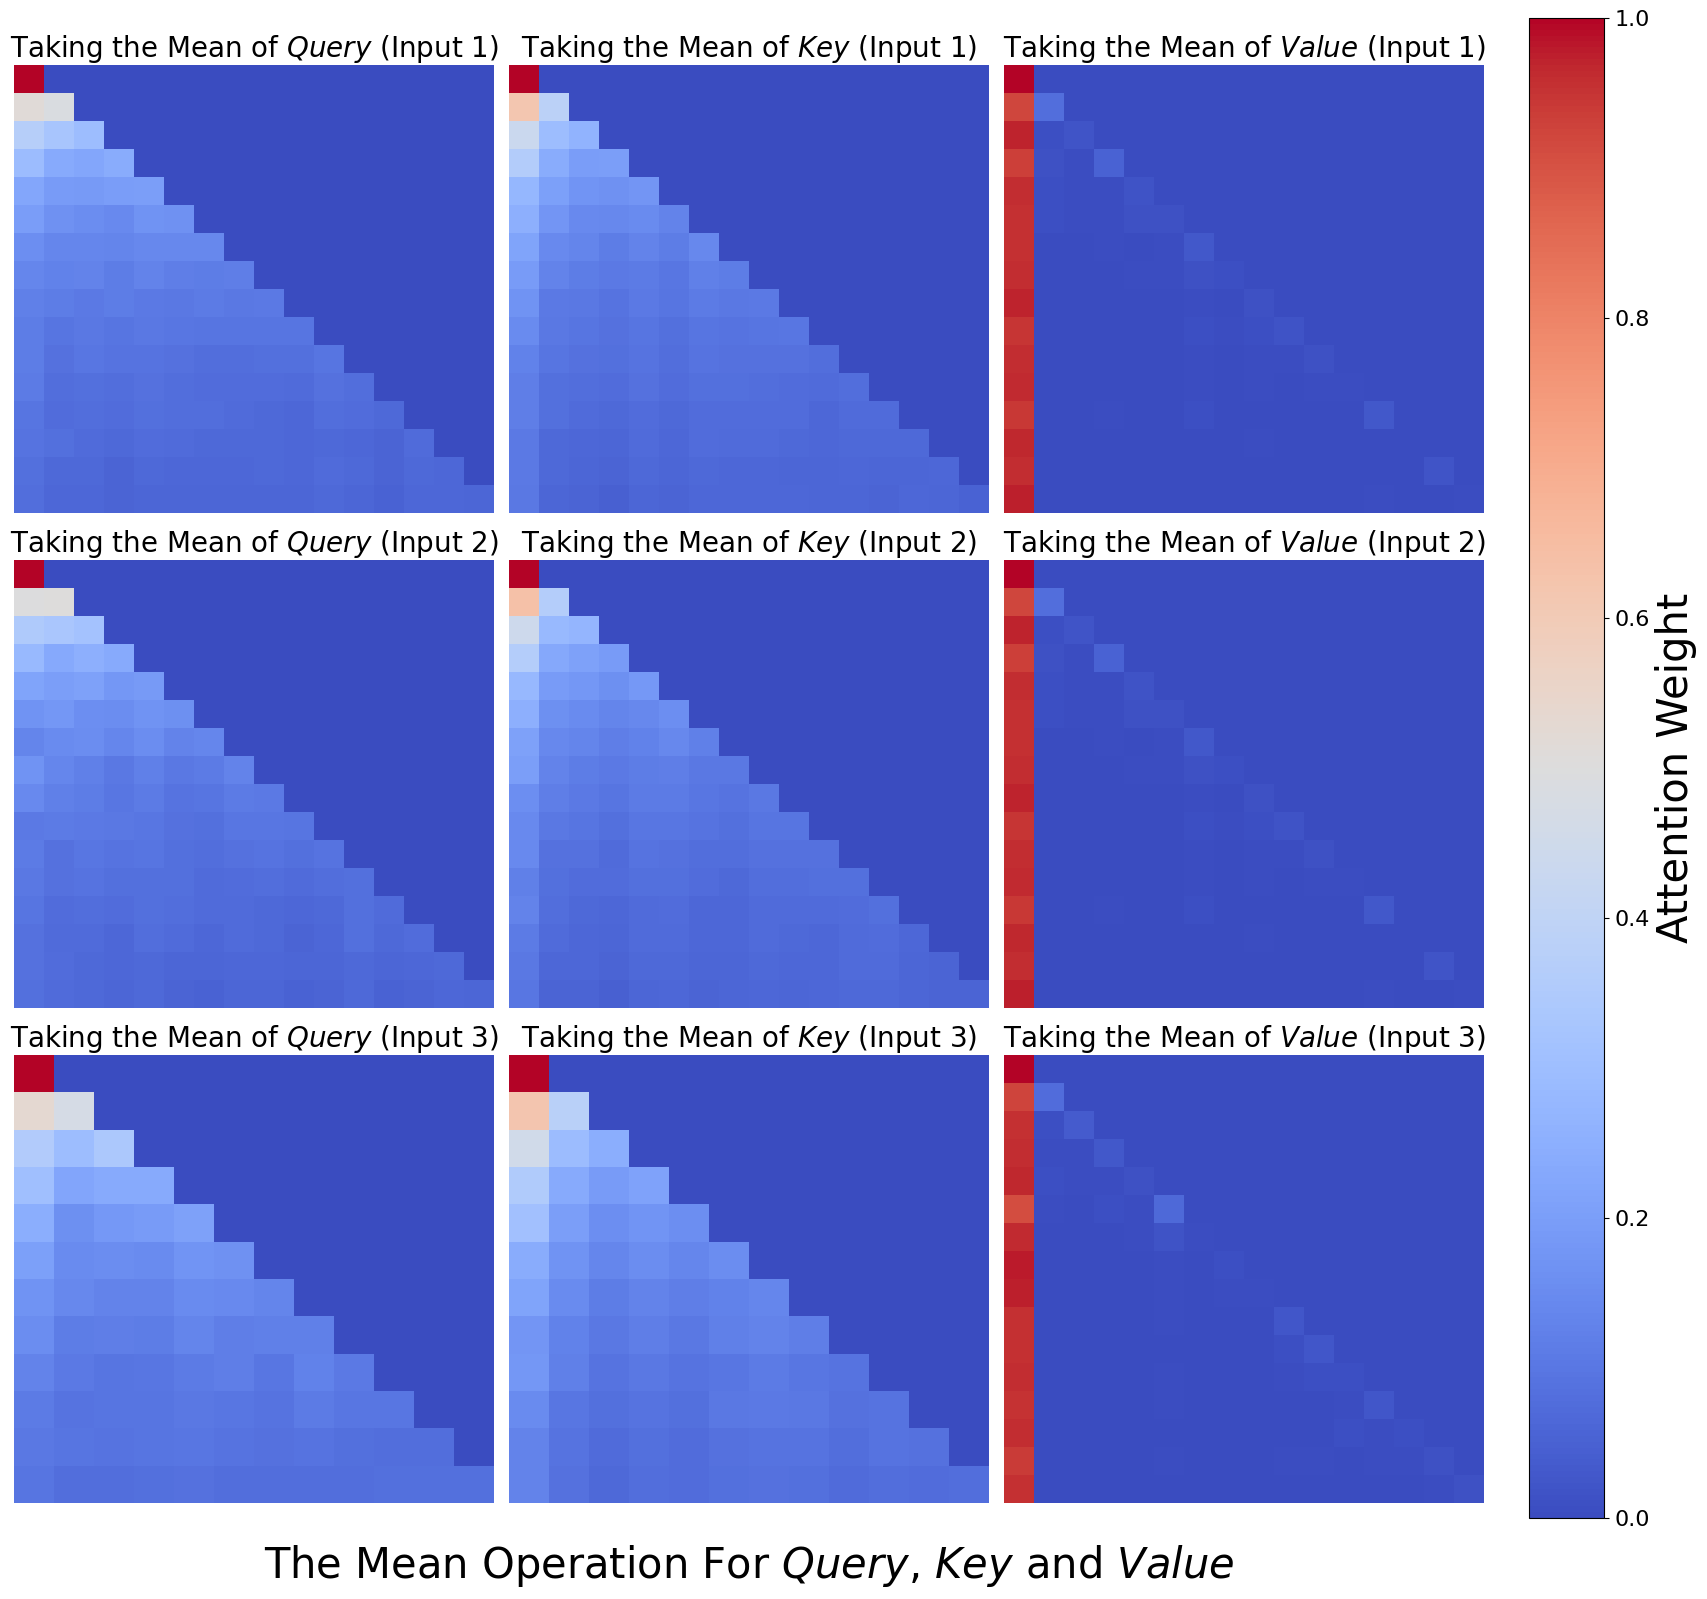
The image presents a 3x3 grid of heatmaps, visualizing attention weights. Each heatmap corresponds to a specific operation (taking the mean) applied to Query, Key, and Value, with three different inputs (Input 1, Input 2, Input 3). The color intensity represents the attention weight, ranging from 0.0 (blue) to 1.0 (red).
### Components/Axes
* **Title:** "The Mean Operation For Query, Key and Value" (located at the bottom center)
* **Y-axis Label:** "Attention Weight" (located on the right side, ranging from 0.0 to 1.0)
* **Heatmap Titles:** Each heatmap has a title indicating the operation and input. Examples: "Taking the Mean of Query (Input 1)", "Taking the Mean of Key (Input 2)", "Taking the Mean of Value (Input 3)".
* **Grid Structure:** 3 rows and 3 columns, representing the combinations of Query/Key/Value and Input 1/2/3.
* **Color Scale:** A continuous color scale from blue (low attention weight) to red (high attention weight).
### Detailed Analysis
Each heatmap is approximately 15x15 cells. The x and y axes of each heatmap are not explicitly labeled, but represent the dimensions over which attention is calculated. The color intensity within each cell represents the attention weight.
**Row 1 (Input 1):**
* **Taking the Mean of Query (Input 1):** The heatmap shows a strong diagonal pattern, with higher attention weights (towards red) along the main diagonal. Attention weights range from approximately 0.2 to 0.9.
* **Taking the Mean of Key (Input 1):** Similar to the Query heatmap, a strong diagonal pattern is observed, with attention weights ranging from approximately 0.2 to 0.9.
* **Taking the Mean of Value (Input 1):** This heatmap exhibits a more scattered pattern, with a few isolated red cells and a generally lower overall attention weight, ranging from approximately 0.1 to 0.6.
**Row 2 (Input 2):**
* **Taking the Mean of Query (Input 2):** The diagonal pattern is less pronounced than in Input 1, with a more gradual increase in attention weight along the diagonal. Weights range from approximately 0.1 to 0.7.
* **Taking the Mean of Key (Input 2):** A clear diagonal pattern is present, with attention weights ranging from approximately 0.2 to 0.8. A vertical red line is present at approximately x=7.
* **Taking the Mean of Value (Input 2):** Similar to Input 1, this heatmap shows a scattered pattern with lower overall attention weights, ranging from approximately 0.1 to 0.5. A vertical red line is present at approximately x=7.
**Row 3 (Input 3):**
* **Taking the Mean of Query (Input 3):** The diagonal pattern is again visible, but less distinct than in Input 1. Attention weights range from approximately 0.1 to 0.6.
* **Taking the Mean of Key (Input 3):** A strong diagonal pattern is observed, with attention weights ranging from approximately 0.2 to 0.8. A vertical red line is present at approximately x=7.
* **Taking the Mean of Value (Input 3):** This heatmap shows a scattered pattern with lower overall attention weights, ranging from approximately 0.1 to 0.5. A vertical red line is present at approximately x=7.
### Key Observations
* **Diagonal Dominance:** The "Taking the Mean of Query" and "Taking the Mean of Key" heatmaps consistently exhibit a strong diagonal pattern across all three inputs, suggesting a higher attention weight for elements that are closer to each other in the sequence.
* **Value Scatter:** The "Taking the Mean of Value" heatmaps consistently show a more scattered pattern with lower overall attention weights, indicating a less focused attention distribution.
* **Vertical Red Line:** A vertical red line appears in the "Taking the Mean of Key" and "Taking the Mean of Value" heatmaps for Inputs 2 and 3, at approximately x=7. This suggests a consistently high attention weight for a specific element in the sequence.
* **Input Variation:** The intensity of the diagonal pattern varies across the three inputs, suggesting that the attention distribution is influenced by the input data.
### Interpretation
The heatmaps visualize the attention weights calculated when taking the mean of Query, Key, and Value for different inputs. The strong diagonal patterns in the Query and Key heatmaps suggest that the model is attending to elements that are close to each other in the sequence, which is a common behavior in attention mechanisms. The scattered pattern in the Value heatmaps indicates that the model is less focused on specific elements when processing the value information.
The vertical red line in the Key and Value heatmaps for Inputs 2 and 3 suggests that a particular element in the sequence consistently receives high attention. This could be due to the importance of that element in the input data or a specific characteristic of the model.
The variation in attention patterns across the three inputs indicates that the attention mechanism is sensitive to the input data and can adapt its attention distribution accordingly. The data suggests that the attention mechanism is functioning as expected, focusing on relevant elements in the sequence and adapting to different inputs. The consistent difference in attention patterns between Query/Key and Value suggests that these components play different roles in the attention process.