## Heatmap Grid: Attention Weight Visualization for Query, Key, and Value Operations
### Overview
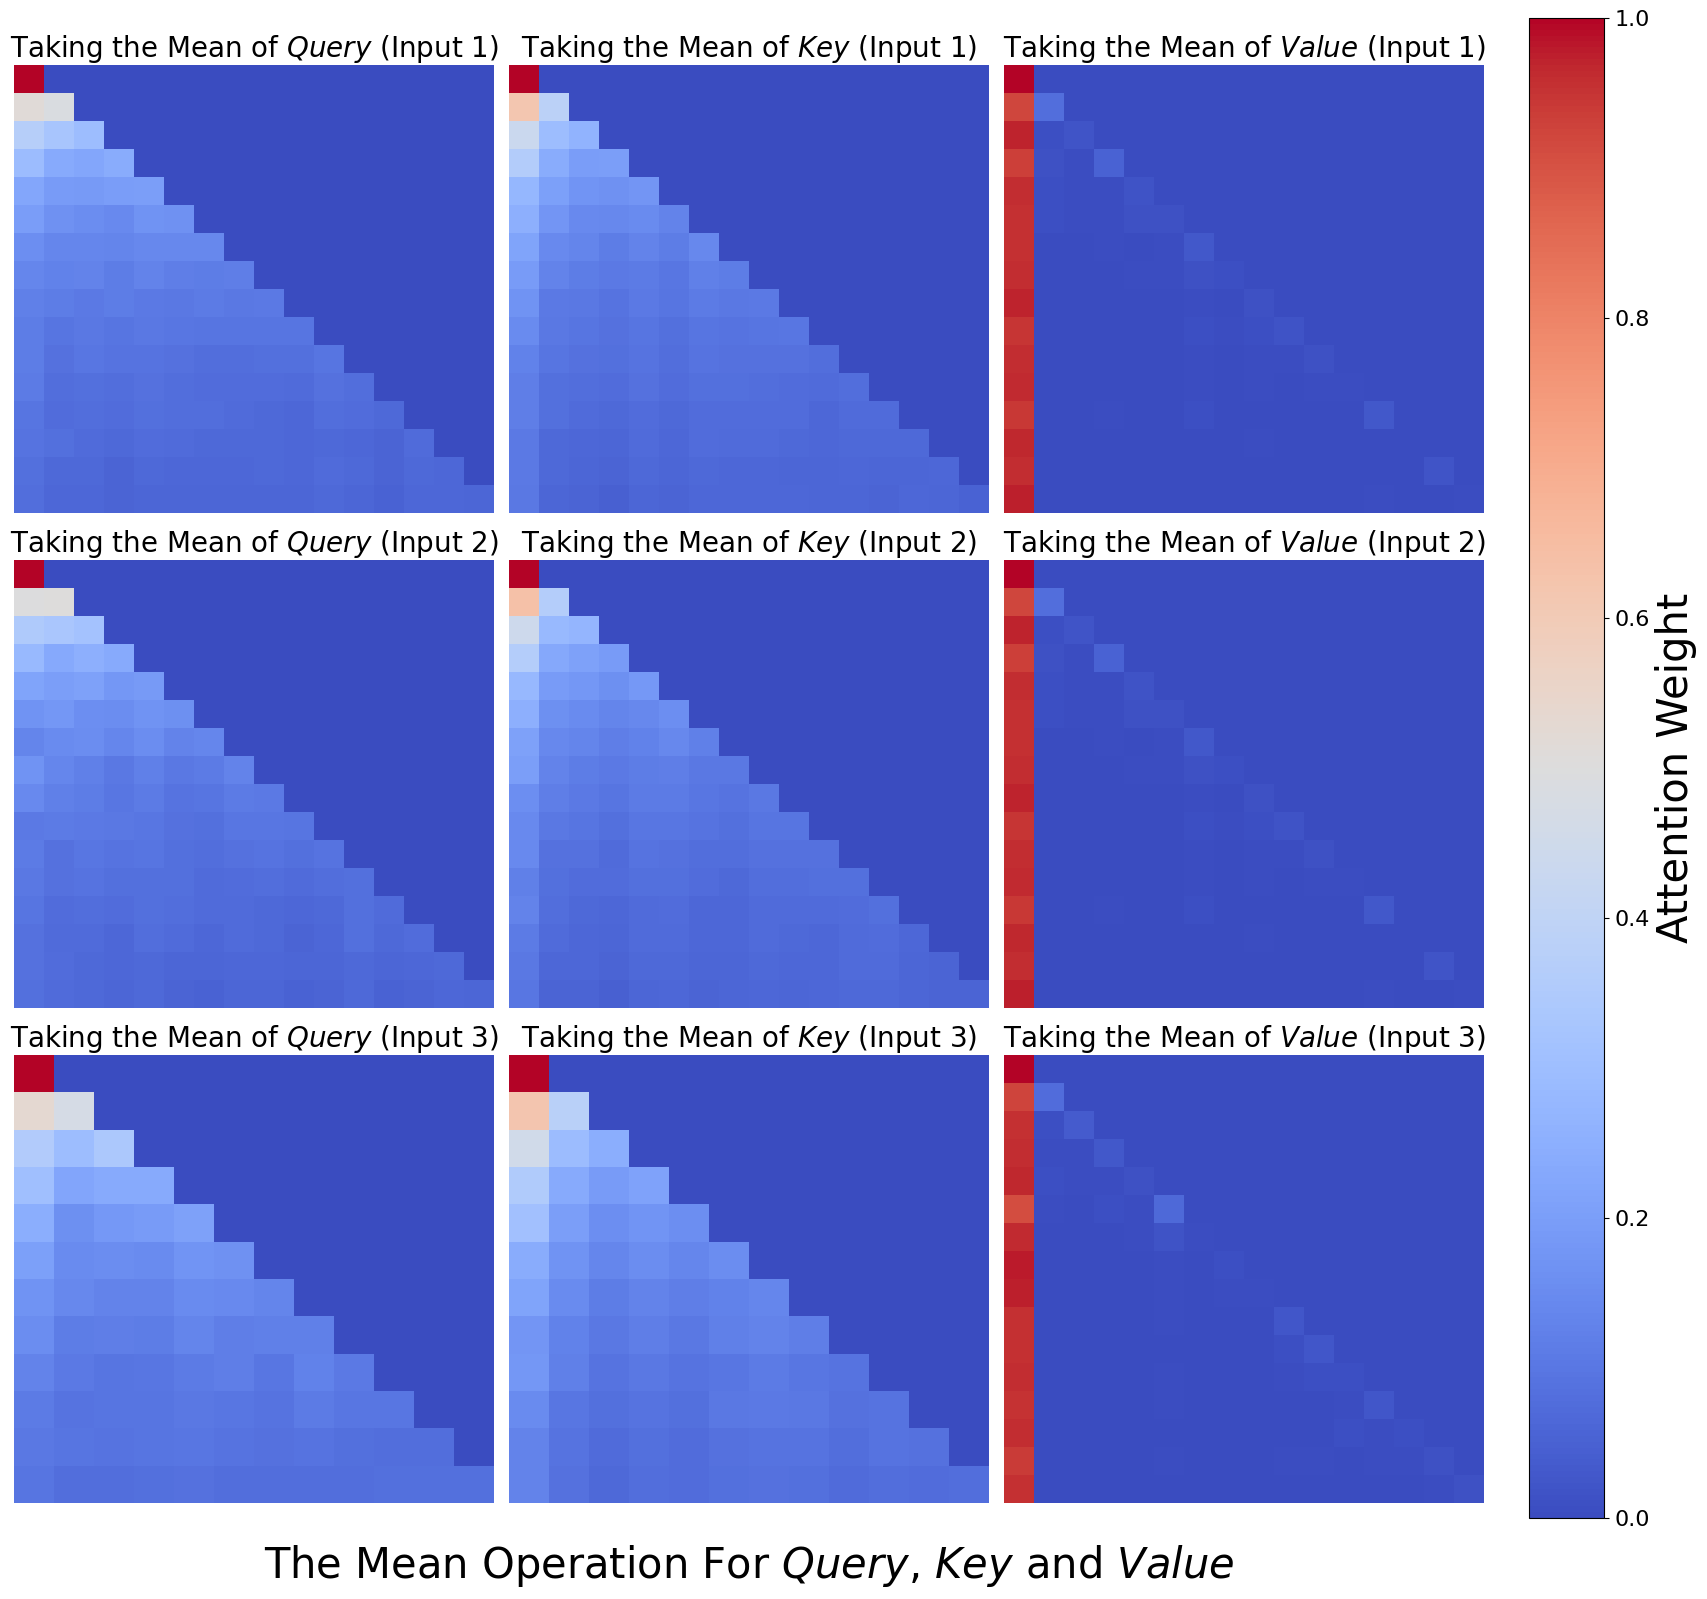
The image displays a 3x3 grid of heatmaps visualizing attention weight distributions across three operations: **Query**, **Key**, and **Value**. Each row and column corresponds to "Input 1", "Input 2", and "Input 3", with color intensity representing attention weight magnitudes (0.0–1.0). The heatmaps reveal diagonal dominance and symmetric patterns, suggesting self-attention mechanisms.
---
### Components/Axes
1. **Rows**:
- **Row 1**: "Taking the Mean of Query (Input 1)"
- **Row 2**: "Taking the Mean of Query (Input 2)"
- **Row 3**: "Taking the Mean of Query (Input 3)"
2. **Columns**:
- **Column 1**: "Taking the Mean of Key (Input 1)"
- **Column 2**: "Taking the Mean of Key (Input 2)"
- **Column 3**: "Taking the Mean of Key (Input 3)"
3. **Color Legend**:
- **Blue (0.0)**: Low attention weight
- **Red (1.0)**: High attention weight
- **Gradient**: Intermediate values (e.g., light blue ≈ 0.2, orange ≈ 0.6)
4. **Axis Markers**:
- Diagonal lines in each heatmap segment the grid into upper/lower triangles.
---
### Detailed Analysis
1. **Diagonal Dominance**:
- All heatmaps show **red squares along the main diagonal** (e.g., Input 1-Query vs. Input 1-Key), indicating **self-attention** (high weights for matching inputs).
- Example: Input 3-Query vs. Input 3-Value has the darkest red (≈1.0).
2. **Upper/Lower Triangles**:
- **Upper triangle** (above diagonal): Gradual transition from red to blue, with weights decreasing from ≈0.8 (near diagonal) to ≈0.0 (top-right corner).
- **Lower triangle** (below diagonal): Mirror image of upper triangle, with weights decreasing from ≈0.8 (near diagonal) to ≈0.0 (bottom-left corner).
3. **Input-Specific Patterns**:
- **Input 1**: Strongest diagonal dominance (≈1.0) and sharpest gradient.
- **Input 2**: Slightly weaker diagonal (≈0.9) and more diffuse gradients.
- **Input 3**: Moderate diagonal (≈0.7) and broader low-weight regions.
4. **Symmetry**:
- Upper and lower triangles exhibit near-perfect symmetry, suggesting bidirectional attention patterns.
---
### Key Observations
1. **Self-Attention Focus**: Diagonal red squares confirm that each input primarily attends to itself.
2. **Consistency Across Inputs**: Similar patterns across Inputs 1–3, but Input 1 shows the highest self-attention.
3. **Gradient Smoothness**: Gradual color transitions suggest smooth attention weight distributions.
4. **No Outliers**: No anomalous regions deviate from the diagonal/gradient pattern.
---
### Interpretation
1. **Mechanism Insight**:
- The diagonal dominance aligns with **self-attention** in transformer models, where tokens attend most strongly to themselves.
- Symmetric upper/lower triangles imply **bidirectional** attention (e.g., Query-Key and Key-Query interactions).
2. **Input Dependency**:
- Input 1’s sharper gradients suggest higher sensitivity to positional relationships, while Input 3’s broader low-weight regions indicate more diffuse attention.
3. **Technical Implications**:
- The heatmaps validate that attention mechanisms prioritize self-comparison over cross-input interactions.
- The grid structure highlights how mean operations aggregate attention weights across inputs.
4. **Limitations**:
- No explicit labels for individual tokens or positional indices, limiting granular analysis.
- Color scale lacks intermediate markers (e.g., 0.4, 0.6), requiring visual estimation.
---
### Spatial Grounding & Verification
- **Legend Position**: Right-aligned color bar with clear 0.0–1.0 scale.
- **Axis Labels**: Rows/columns explicitly labeled with operations and inputs.
- **Color Consistency**: Red squares on diagonals match the legend’s 1.0 value; blue corners match 0.0.
---
### Content Details
- **Heatmap Values** (approximate):
- Diagonal: 0.7–1.0 (red)
- Near-diagonal (1 step away): 0.5–0.8 (orange)
- Far from diagonal: 0.0–0.2 (blue)
- **Grid Structure**: 3x3 matrix with uniform patterns across rows/columns.
---
### Final Notes
The heatmaps provide a clear visualization of attention weight distributions, emphasizing self-attention and input-dependent variations. The absence of textual annotations beyond axis labels and legends necessitates reliance on color gradients for quantitative interpretation.