## Line Graph: ΔP vs. Layer for GPT-3 Models (8B and 32B)
### Overview
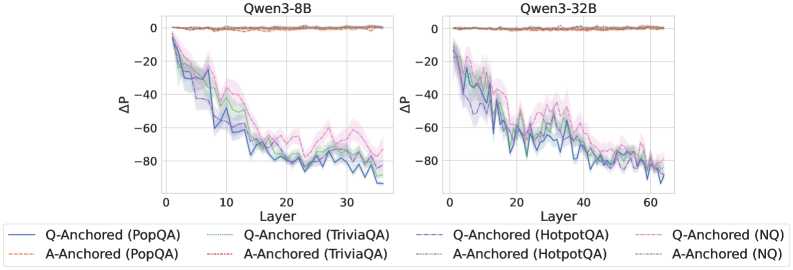
The image contains two side-by-side line graphs comparing the performance (ΔP) of different question-answering (QA) and answer-anchored (A-Anchored) models across layers in two GPT-3 variants: **Qwen3-8B** (left) and **Qwen3-32B** (right). The y-axis represents ΔP (change in performance), and the x-axis represents the layer number. Each graph includes multiple data series with distinct line styles and colors, as defined in the legend.
---
### Components/Axes
- **X-Axis (Layer)**:
- Labeled "Layer" for both subplots.
- Ranges from 0 to 30 (8B) and 0 to 60 (32B).
- **Y-Axis (ΔP)**:
- Labeled "ΔP" for both subplots.
- Ranges from -80 to 0.
- **Legends**:
- **Left Subplot (8B)**:
- Solid blue: Q-Anchored (PopQA)
- Dashed orange: A-Anchored (PopQA)
- Dotted green: Q-Anchored (TriviaQA)
- Dash-dot red: A-Anchored (TriviaQA)
- Solid purple: Q-Anchored (HotpotQA)
- Dashed pink: Q-Anchored (NQ)
- **Right Subplot (32B)**:
- Same legend as 8B, but with additional dashed pink line for Q-Anchored (NQ).
---
### Detailed Analysis
#### Qwen3-8B (Left Subplot)
1. **Q-Anchored (PopQA)** (solid blue):
- Starts at 0, drops sharply to ~-60 by layer 10, then fluctuates between -60 and -40.
- Confidence interval (shaded area) widens slightly after layer 20.
2. **A-Anchored (PopQA)** (dashed orange):
- Remains near 0 throughout, with minimal fluctuation.
3. **Q-Anchored (TriviaQA)** (dotted green):
- Starts at ~-20, dips to ~-70 by layer 20, then stabilizes.
4. **A-Anchored (TriviaQA)** (dash-dot red):
- Starts at ~-10, dips to ~-50 by layer 20, then stabilizes.
5. **Q-Anchored (HotpotQA)** (solid purple):
- Starts at ~-10, dips to ~-50 by layer 20, then stabilizes.
6. **Q-Anchored (NQ)** (dashed pink):
- Starts at ~-10, dips to ~-70 by layer 20, then fluctuates between -70 and -50.
#### Qwen3-32B (Right Subplot)
1. **Q-Anchored (PopQA)** (solid blue):
- Starts at 0, drops to ~-50 by layer 20, then stabilizes.
2. **A-Anchored (PopQA)** (dashed orange):
- Remains near 0 throughout.
3. **Q-Anchored (TriviaQA)** (dotted green):
- Starts at ~-30, dips to ~-70 by layer 40, then stabilizes.
4. **A-Anchored (TriviaQA)** (dash-dot red):
- Starts at ~-20, dips to ~-60 by layer 40, then stabilizes.
5. **Q-Anchored (HotpotQA)** (solid purple):
- Starts at ~-20, dips to ~-60 by layer 40, then stabilizes.
6. **Q-Anchored (NQ)** (dashed pink):
- Starts at ~-10, dips to ~-80 by layer 60, then fluctuates between -80 and -60.
---
### Key Observations
1. **Stability of A-Anchored Models**:
- A-Anchored models (PopQA, TriviaQA, HotpotQA) consistently show minimal ΔP changes, remaining near 0 across layers.
2. **Volatility of Q-Anchored Models**:
- Q-Anchored models exhibit significant ΔP fluctuations, especially for NQ (Question-Answering) tasks.
3. **Layer-Specific Trends**:
- Layers 10–20 (8B) and 20–40 (32B) show the most pronounced performance drops for Q-Anchored models.
4. **Confidence Intervals**:
- Shaded areas around lines indicate uncertainty, which increases for Q-Anchored models in deeper layers.
---
### Interpretation
- **Anchoring Method Impact**:
- A-Anchored models (answer-focused) demonstrate stability, suggesting they are less sensitive to layer-specific variations.
- Q-Anchored models (question-focused) show higher variability, possibly due to the complexity of question-answering tasks.
- **Model Size Effects**:
- The 32B model exhibits more pronounced fluctuations than the 8B model, indicating that larger models may amplify the impact of anchoring methods.
- **NQ Task Challenges**:
- The Q-Anchored (NQ) line in both subplots shows the most erratic behavior, highlighting difficulties in handling open-ended questions.
- **Confidence Intervals**:
- Wider shaded regions for Q-Anchored models suggest greater uncertainty in performance measurements, particularly in deeper layers.
---
### Spatial Grounding
- **Legends**: Positioned at the bottom of each subplot, with clear color/style mappings.
- **Data Series**: Lines are plotted directly above their corresponding legend entries, with no overlap in color/style.
- **Axis Alignment**: Both subplots share identical axis labels and scales, enabling direct comparison.
---
### Content Details
- **Numerical Approximations**:
- ΔP values are estimated from the graph's scale (e.g., ~-60, ~-70) with ±5 uncertainty due to visual estimation.
- Layer numbers are exact (0–30 for 8B, 0–60 for 32B).
- **Text Embedding**: No additional text is present in the diagram beyond axis labels and legends.
---
### Final Notes
The graph emphasizes the trade-off between anchoring methods and model performance stability. A-Anchored models prioritize consistency, while Q-Anchored models trade stability for potential gains in specific tasks. The 32B model's increased layer count amplifies these trends, suggesting architectural complexity influences anchoring effectiveness.