# Technical Document Extraction: Heatmap Analysis
## 1. **Image Structure and Components**
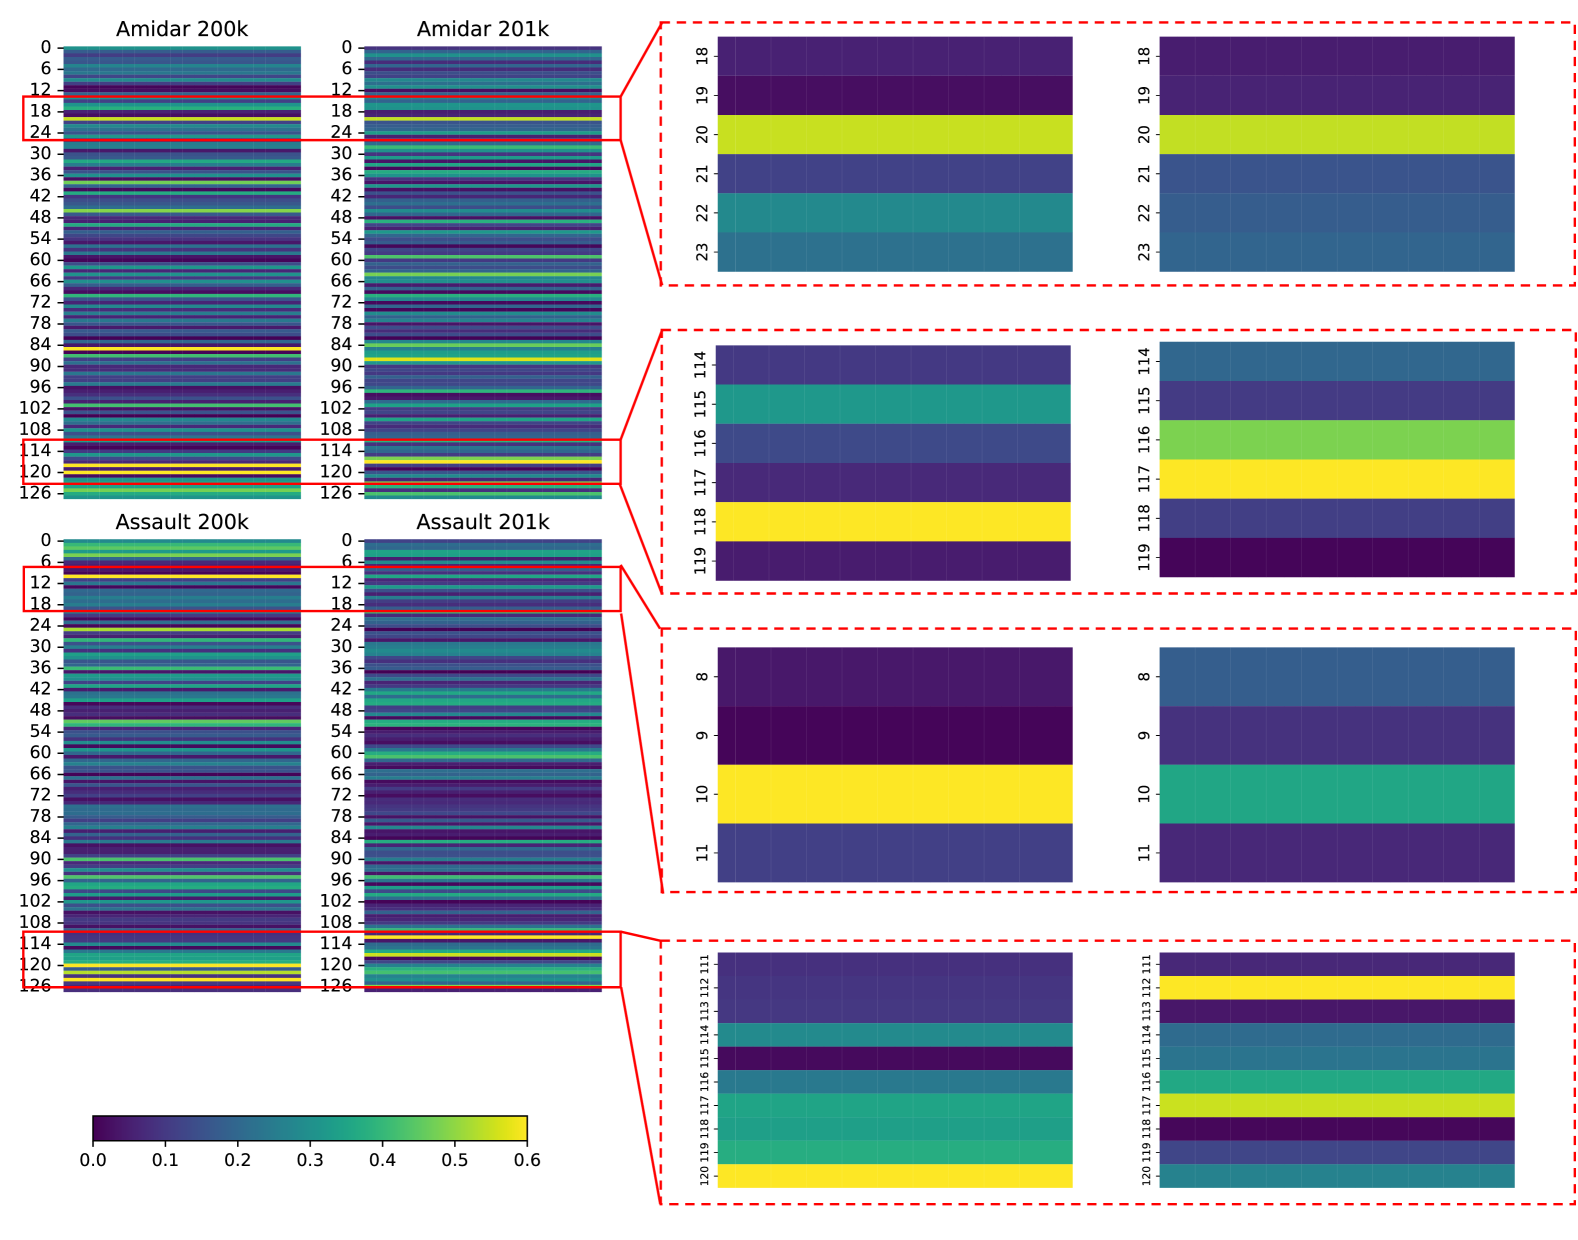
The image is a composite of **four primary heatmaps** (Amidar 200k, Amidar 201k, Assault 200k, Assault 201k) and their corresponding **zoomed insets**. Each heatmap is divided into **horizontal bands** (y-axis) and **vertical bands** (x-axis), with color intensity representing a numerical value. The heatmaps are annotated with **red boxes** and **yellow lines** to highlight specific regions.
---
## 2. **Axis Labels and Titles**
- **X-axis**: Labeled **"Time (ms)"** (horizontal axis).
- **Y-axis**: Labeled **"Frame Number"** (vertical axis).
- **Color Bar**: Labeled **"Value"** (ranging from **0.0 to 0.6**).
- **Heatmap Titles**:
- **Top Row**: "Amidar 200k" (left), "Amidar 201k" (right).
- **Bottom Row**: "Assault 200k" (left), "Assault 201k" (right).
- **Inset Titles**:
- "Amidar 200k (Zoomed)" (top-left inset).
- "Amidar 201k (Zoomed)" (top-right inset).
- "Assault 200k (Zoomed)" (bottom-left inset).
- "Assault 201k (Zoomed)" (bottom-right inset).
---
## 3. **Heatmap Categories and Sub-Categories**
### **Main Heatmaps**
- **Frame Numbers (Y-axis)**: 0, 6, 12, 18, 24, 30, 36, 42, 48, 54, 60, 66, 72, 78, 84, 90, 96, 102, 108, 114, 120, 126.
- **Time (X-axis)**: Not explicitly labeled with numerical values, but the heatmap spans a continuous range of time steps.
### **Zoomed Insets**
- **Amidar 200k (Zoomed)**: Focuses on **Frame Numbers 18–24**.
- **Amidar 201k (Zoomed)**: Focuses on **Frame Numbers 18–24**.
- **Assault 200k (Zoomed)**: Focuses on **Frame Numbers 18–24**.
- **Assault 201k (Zoomed)**: Focuses on **Frame Numbers 114–126**.
---
## 4. **Annotations and Highlighted Regions**
- **Red Boxes**:
- **Amidar 200k**: Highlights **Frame Numbers 18–24**.
- **Amidar 201k**: Highlights **Frame Numbers 18–24**.
- **Assault 200k**: Highlights **Frame Numbers 18–24**.
- **Assault 201k**: Highlights **Frame Numbers 114–126**.
- **Yellow Lines**:
- **Amidar 200k**: Horizontal line at **Frame 18**.
- **Amidar 201k**: Horizontal line at **Frame 18**.
- **Assault 200k**: Horizontal line at **Frame 18**.
- **Assault 201k**: Horizontal line at **Frame 119**.
---
## 5. **Color Scale and Legend**
- **Color Bar**:
- **Range**: 0.0 (purple) to 0.6 (yellow).
- **Placement**: Bottom-left corner of the image.
- **Legend**: No explicit legend, but the color bar serves as the reference for value interpretation.
---
## 6. **Key Trends and Data Points**
### **Amidar 200k**
- **Main Heatmap**:
- **Frame 18–24**: Gradual increase in intensity (purple → yellow).
- **Frame 18**: Yellow line indicates a threshold or baseline.
- **Zoomed Inset**:
- **Frame 18–24**: Consistent gradient from purple to yellow, with higher intensity at the top (Frame 24).
### **Amidar 201k**
- **Main Heatmap**:
- **Frame 18–24**: Similar gradient to Amidar 200k but with more pronounced yellow regions.
- **Frame 18**: Yellow line aligns with the red box.
- **Zoomed Inset**:
- **Frame 18–24**: Slightly higher intensity at Frame 24 compared to Amidar 200k.
### **Assault 200k**
- **Main Heatmap**:
- **Frame 18–24**: Gradient from purple to yellow, with a sharp increase at Frame 24.
- **Frame 18**: Yellow line marks a baseline.
- **Zoomed Inset**:
- **Frame 18–24**: Steeper gradient, with higher intensity at Frame 24.
### **Assault 201k**
- **Main Heatmap**:
- **Frame 114–126**: Gradual increase in intensity (purple → yellow).
- **Frame 119**: Yellow line indicates a threshold.
- **Zoomed Inset**:
- **Frame 114–126**: Consistent gradient, with higher intensity at Frame 126.
---
## 7. **Spatial Grounding and Color Matching**
- **Legend Position**: Bottom-left corner (color bar).
- **Color Matching**:
- **Purple**: Low values (0.0–0.2).
- **Green**: Medium values (0.3–0.4).
- **Yellow**: High values (0.5–0.6).
- **Red Boxes**: Highlight regions with moderate to high intensity (green/yellow).
- **Yellow Lines**: Mark specific frame thresholds (e.g., Frame 18, 119).
---
## 8. **Component Isolation**
### **Header**
- Titles: "Amidar 200k", "Amidar 201k", "Assault 200k", "Assault 201k".
- Color bar: "Value" (0.0–0.6).
### **Main Chart**
- Heatmaps with frame numbers (0–126) and time (ms) axes.
- Red boxes and yellow lines as annotations.
### **Footer**
- Zoomed insets for each dataset, focusing on specific frame ranges.
---
## 9. **Language and Transcription**
- **Primary Language**: English.
- **No Other Languages Detected**.
---
## 10. **Final Notes**
- The heatmaps visualize **temporal patterns** (time vs. frame number) with color intensity representing a metric (e.g., error, performance, or activity level).
- **Red boxes** and **yellow lines** are **annotations** to emphasize specific regions of interest.
- **No numerical data table** is present; the heatmap relies on visual interpretation of color gradients.
---
**Conclusion**: The image provides a comparative analysis of two datasets (Amidar and Assault) across two time periods (200k and 201k), with annotations to highlight critical regions. The color scale and annotations suggest a focus on **thresholds** (yellow lines) and **trends** (red boxes).