```markdown
## Dashboard: AI Interaction Analysis
### Overview
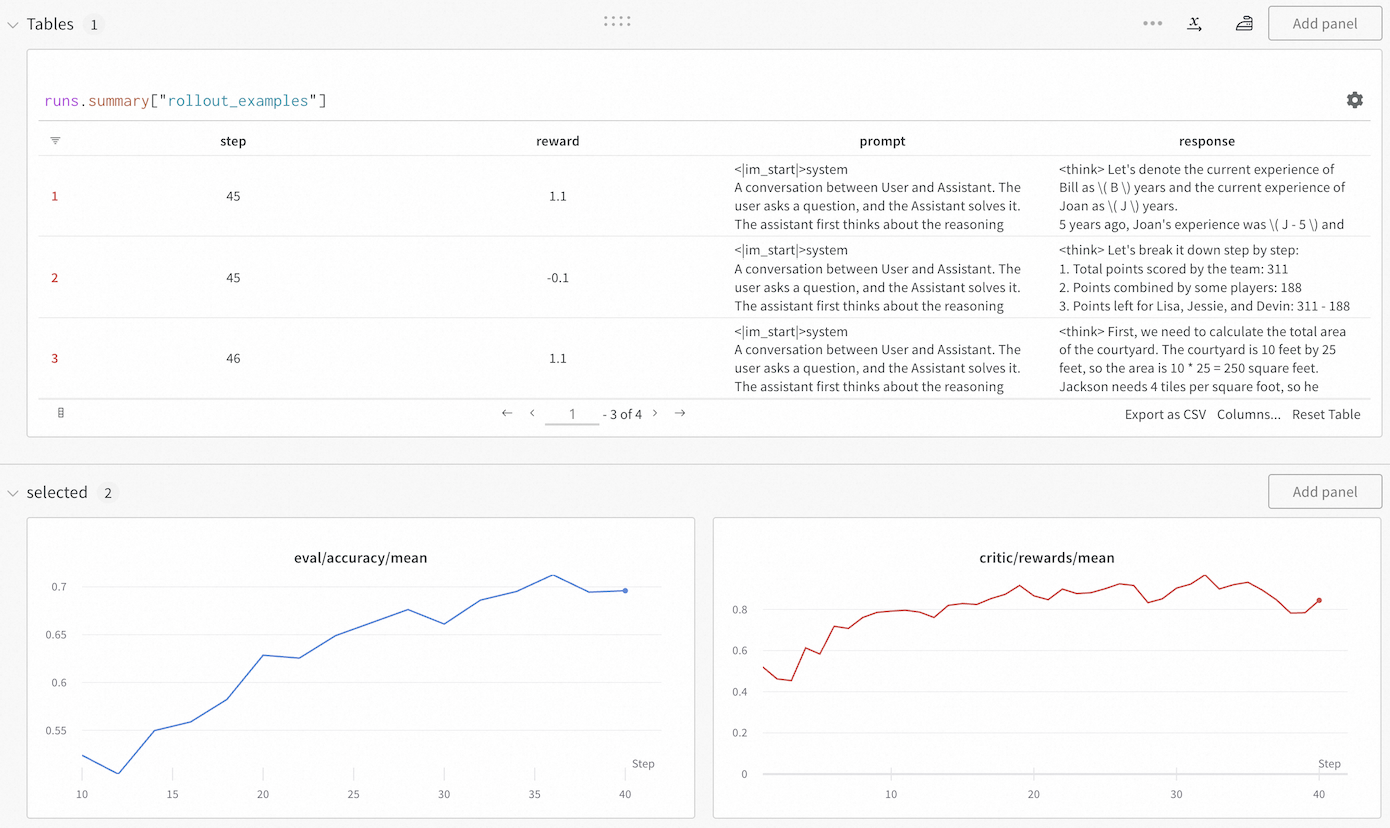
The image displays a technical dashboard analyzing AI interaction data. It includes:
1. A table showing structured data for three steps (1-3)
2. Two line graphs tracking evaluation metrics over 40 steps
3. Text-based prompts and responses demonstrating AI reasoning
### Components/Axes
**Table Structure**:
- Columns: Step | Reward | Prompt | Response
- Rows: 3 entries (Steps 1-3)
**Graphs**:
1. **eval/accuracy/mean** (Blue line):
- X-axis: Step (1-40)
- Y-axis: Accuracy (0.52-0.70)
2. **critic/rewards/mean** (Red line):
- X-axis: Step (1-40)
- Y-axis: Rewards (0.2-0.85)
**Text Elements**:
- Table headers in bold black text
- Graph titles in bold black text
- Axis labels in smaller black text
### Detailed Analysis
**Table Data**:
| Step | Reward | Prompt (Example) | Response (Example) |
|------|--------|------------------|--------------------|
| 1 | 1.1 |