## Bar Chart: Exact Match vs. SFT Data Ratio
### Overview
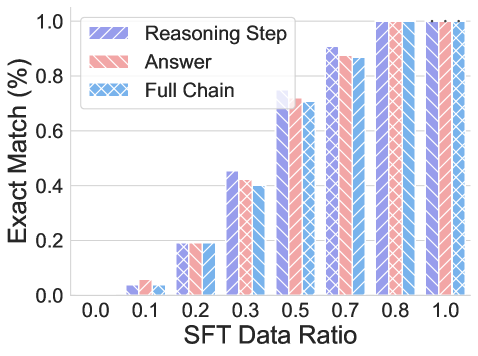
The image is a bar chart comparing the "Exact Match (%)" for "Reasoning Step", "Answer", and "Full Chain" against varying "SFT Data Ratio" values. The chart shows how the exact match percentage changes as the SFT data ratio increases.
### Components/Axes
* **Y-axis:** "Exact Match (%)", with a scale from 0.0 to 1.0 in increments of 0.2.
* **X-axis:** "SFT Data Ratio", with values 0.0, 0.1, 0.2, 0.3, 0.5, 0.7, 0.8, and 1.0.
* **Legend (Top-Left):**
* Reasoning Step (Blue with diagonal hatching)
* Answer (Red with diagonal hatching)
* Full Chain (Light Blue with diagonal hatching)
### Detailed Analysis
Here's a breakdown of the data for each category:
* **Reasoning Step (Blue):**
* Trend: Generally increases with the SFT Data Ratio.
* Values:
* 0.0: ~0.0
* 0.1: ~0.04
* 0.2: ~0.19
* 0.3: ~0.45
* 0.5: ~0.73
* 0.7: ~0.90
* 0.8: ~0.97
* 1.0: ~0.99
* **Answer (Red):**
* Trend: Generally increases with the SFT Data Ratio.
* Values:
* 0.0: ~0.0
* 0.1: ~0.06
* 0.2: ~0.19
* 0.3: ~0.40
* 0.5: ~0.68
* 0.7: ~0.87
* 0.8: ~0.95
* 1.0: ~0.98
* **Full Chain (Light Blue):**
* Trend: Generally increases with the SFT Data Ratio.
* Values:
* 0.0: ~0.0
* 0.1: ~0.03
* 0.2: ~0.20
* 0.3: ~0.41
* 0.5: ~0.70
* 0.7: ~0.88
* 0.8: ~0.96
* 1.0: ~0.99
### Key Observations
* All three categories ("Reasoning Step", "Answer", and "Full Chain") show a positive correlation between "SFT Data Ratio" and "Exact Match (%)".
* The "Reasoning Step" category consistently has a slightly higher "Exact Match (%)" than the "Answer" and "Full Chain" categories for most "SFT Data Ratio" values.
* The "Exact Match (%)" values for all three categories converge and approach 1.0 as the "SFT Data Ratio" increases to 0.8 and 1.0.
* At lower "SFT Data Ratio" values (0.0 and 0.1), the "Exact Match (%)" is very low for all categories.
### Interpretation
The chart suggests that increasing the "SFT Data Ratio" significantly improves the "Exact Match (%)" for all three categories: "Reasoning Step", "Answer", and "Full Chain". This indicates that the model's performance, measured by exact match, is highly dependent on the amount of SFT (Supervised Fine-Tuning) data used. The "Reasoning Step" category performing slightly better than "Answer" and "Full Chain" might indicate that the model benefits more from fine-tuning on reasoning steps compared to the final answer or the full chain of reasoning. The convergence of all three categories at higher "SFT Data Ratio" values suggests that with sufficient fine-tuning data, the model can achieve near-perfect exact match performance regardless of whether it's evaluated on reasoning steps, answers, or the full chain.