## Grouped Bar Chart: Exact Match vs. SFT Data Ratio
### Overview
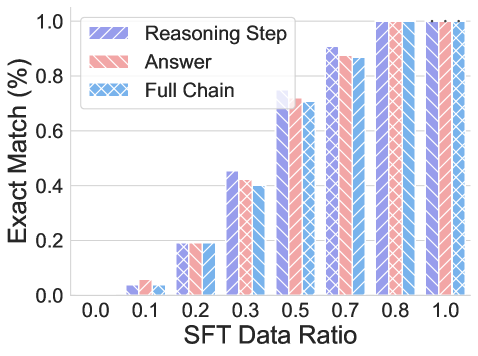
The image is a grouped bar chart displaying the performance of a model (likely a Large Language Model) measured by "Exact Match (%)" against varying "SFT Data Ratio" (Supervised Fine-Tuning Data Ratio) values. The chart compares performance across three distinct evaluation criteria: "Reasoning Step," "Answer," and "Full Chain."
### Components/Axes
* **Y-Axis:** Labeled "Exact Match (%)". The scale ranges from 0.0 to 1.0 in increments of 0.2.
* **X-Axis:** Labeled "SFT Data Ratio". The categories are discrete values: 0.0, 0.1, 0.2, 0.3, 0.5, 0.7, 0.8, and 1.0.
* **Legend (Positioned Top-Left):**
* **Purple (diagonal stripes):** Reasoning Step
* **Red/Pink (diagonal stripes):** Answer
* **Blue (diagonal stripes):** Full Chain
### Detailed Analysis
**Trend Verification:** All three data series exhibit a strong positive correlation with the SFT Data Ratio. As the ratio increases from 0.0 to 0.8, the Exact Match percentage increases monotonically. Performance plateaus at 1.0 (100%) for all metrics once the ratio reaches 0.8.
**Data Points (Approximate Values):**
| SFT Data Ratio | Reasoning Step (Purple) | Answer (Red) | Full Chain (Blue) |
| :--- | :--- | :--- | :--- |
| **0.0** | 0.0 | 0.0 | 0.0 |
| **0.1** | ~0.04 | ~0.06 | ~0.04 |
| **0.2** | ~0.20 | ~0.20 | ~0.20 |
| **0.3** | ~0.45 | ~0.42 | ~0.40 |
| **0.5** | ~0.75 | ~0.72 | ~0.70 |
| **0.7** | ~0.90 | ~0.87 | ~0.86 |
| **0.8** | 1.0 | 1.0 | 1.0 |
| **1.0** | 1.0 | 1.0 | 1.0 |
### Key Observations
* **Performance Saturation:** The model achieves perfect "Exact Match" scores (1.0) at an SFT Data Ratio of 0.8. Increasing the data ratio further to 1.0 yields no additional performance gain.
* **Metric Hierarchy:** In the mid-range (0.3 to 0.7), there is a consistent hierarchy in performance: "Reasoning Step" (Purple) > "Answer" (Red) > "Full Chain" (Blue). This suggests that while the model is highly capable of generating correct individual reasoning steps, the cumulative requirement of the "Full Chain" makes it the most difficult metric to satisfy.
* **Threshold Effect:** There is a significant jump in performance between the 0.1 and 0.2 ratios, suggesting a critical threshold of SFT data is required before the model begins to generalize effectively.
### Interpretation
This data demonstrates the efficacy of Supervised Fine-Tuning (SFT) in improving model performance on specific tasks. The hierarchy of metrics (Reasoning Step vs. Full Chain) provides insight into the model's failure modes: it is easier for the model to get a single step correct than to maintain correctness across the entire chain of thought.
The plateau at 0.8 suggests that for this specific dataset and task, 80% of the SFT data is sufficient to reach peak performance. This implies that the remaining 20% of the data (from 0.8 to 1.0) may be redundant or provide diminishing returns, which is a critical finding for optimizing training efficiency and reducing computational costs.