## Algorithm Flow Diagram: PPO vs. GRPO
### Overview
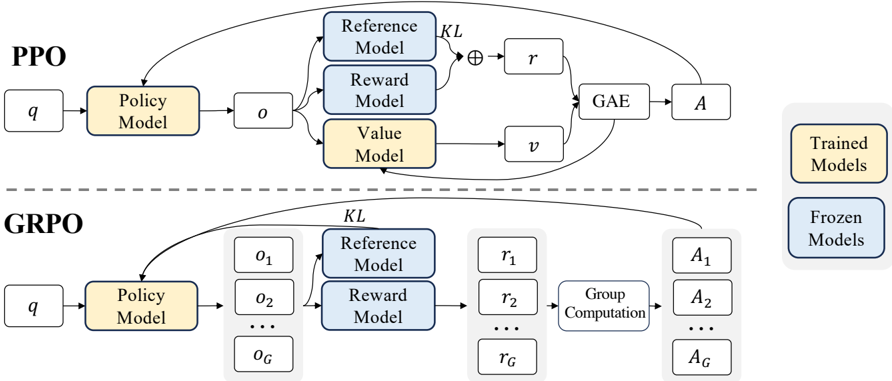
The image presents a comparative diagram illustrating the flow of two reinforcement learning algorithms: Proximal Policy Optimization (PPO) and Grouped Robust Policy Optimization (GRPO). The diagram highlights the key components and data flow within each algorithm, emphasizing the differences in their architectures and processes.
### Components/Axes
* **Title:** PPO (top), GRPO (bottom)
* **Blocks:** Representing models, computations, and data.
* **Arrows:** Indicating the flow of data and processes.
* **Labels:**
* `q`: Input to the Policy Model
* `Policy Model`: A core component in both algorithms.
* `o`: Output of the Policy Model in PPO. `o1`, `o2`, ..., `oG` in GRPO.
* `Reference Model`: Used in both algorithms.
* `Reward Model`: Used in both algorithms.
* `Value Model`: Used in PPO.
* `r`: Reward signal in PPO. `r1`, `r2`, ..., `rG` in GRPO.
* `v`: Value function in PPO.
* `GAE`: Generalized Advantage Estimation in PPO.
* `Group Computation`: Process specific to GRPO.
* `A`: Advantage function in PPO. `A1`, `A2`, ..., `AG` in GRPO.
* `KL`: Kullback-Leibler divergence.
* **Legend (Right Side):**
* Yellow: Trained Models
* Blue: Frozen Models
### Detailed Analysis
**PPO (Top)**
1. **Input:** `q` feeds into the `Policy Model`.
2. **Policy Model:** The output `o` from the `Policy Model` is fed into the `Reference Model`, `Reward Model`, and `Value Model`. The `Policy Model` is colored yellow, indicating it is a "Trained Model".
3. **Reference and Reward Models:** The outputs of the `Reference Model` and `Reward Model` are combined using an operation denoted by a circle with a plus sign inside (⊕), along with a `KL` divergence term, to produce `r`. The `Reference Model` and `Reward Model` are colored blue, indicating they are "Frozen Models".
4. **Value Model:** The `Value Model` outputs `v`. The `Value Model` is colored yellow, indicating it is a "Trained Model".
5. **GAE:** `r` and `v` are fed into `GAE` (Generalized Advantage Estimation).
6. **Advantage:** The output of `GAE` is `A`.
7. **Feedback Loop:** There is a feedback loop from `A` back into the `GAE` and the `Policy Model`.
**GRPO (Bottom)**
1. **Input:** `q` feeds into the `Policy Model`.
2. **Policy Model:** The output of the `Policy Model` is a set of values `o1`, `o2`, ..., `oG`. The `Policy Model` is colored yellow, indicating it is a "Trained Model".
3. **Reference and Reward Models:** The outputs `o1`, `o2`, ..., `oG` are fed into the `Reference Model` and `Reward Model`. The `Reference Model` and `Reward Model` are colored blue, indicating they are "Frozen Models".
4. **Reward Signals:** The outputs of the `Reference Model` and `Reward Model`, along with a `KL` divergence term, produce a set of reward signals `r1`, `r2`, ..., `rG`.
5. **Group Computation:** The reward signals `r1`, `r2`, ..., `rG` are fed into a `Group Computation` block.
6. **Advantage:** The output of the `Group Computation` block is a set of advantage functions `A1`, `A2`, ..., `AG`.
7. **Feedback Loop:** There is a feedback loop from `A1`, `A2`, ..., `AG` back into the `Policy Model`.
### Key Observations
* **Model Types:** Both PPO and GRPO use a `Policy Model`, `Reference Model`, and `Reward Model`. PPO also uses a `Value Model`.
* **Frozen vs. Trained Models:** The `Reference Model` and `Reward Model` are "Frozen Models" (blue), while the `Policy Model` and `Value Model` (in PPO) are "Trained Models" (yellow).
* **Grouped Structure:** GRPO introduces a grouped structure for observations, rewards, and advantages (`oG`, `rG`, `AG`), along with a `Group Computation` step.
* **KL Divergence:** Both algorithms incorporate a Kullback-Leibler (KL) divergence term.
* **Feedback Loops:** Both algorithms have feedback loops from the advantage function(s) back to the `Policy Model`.
### Interpretation
The diagram illustrates the architectural differences between PPO and GRPO. GRPO introduces a grouped structure, allowing it to handle multiple observations, rewards, and advantages simultaneously. This suggests that GRPO is designed for environments or tasks where considering groups of data points is beneficial. The use of "Frozen Models" for the `Reference Model` and `Reward Model` in both algorithms implies that these models are pre-trained or fixed during the training process, potentially to provide a stable reference or reward signal. The feedback loops in both algorithms are characteristic of reinforcement learning, allowing the policy to be iteratively improved based on the observed advantages.