## Diagram: PPO vs. GRPO Model Architectures
### Overview
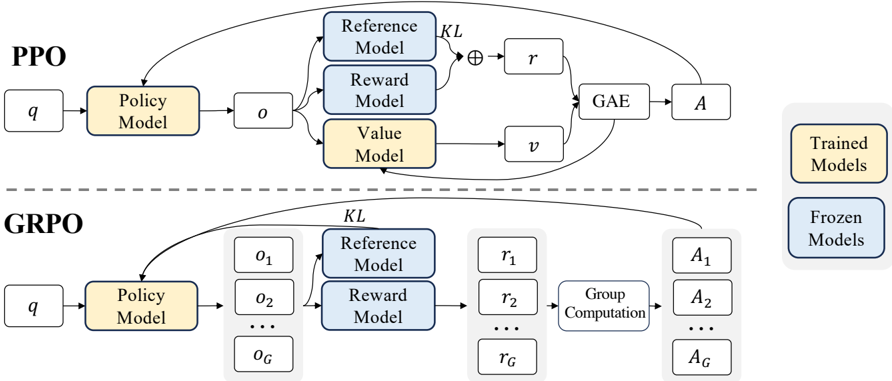
The image presents a comparative diagram illustrating the architectures of two reinforcement learning algorithms: Proximal Policy Optimization (PPO) and Group Proximal Policy Optimization (GRPO). The diagram visually contrasts the data flow and model interactions within each algorithm. The top section details PPO, while the bottom section details GRPO. Both sections share similar components but differ in how they handle groups of data.
### Components/Axes
The diagram consists of several key components:
* **PPO Section (Top):**
* `q`: Input query.
* **Policy Model:** Processes `q` and outputs `o` (observation).
* **Reference Model:** Receives `o` and contributes to the calculation of `KL` divergence.
* **Reward Model:** Receives `o` and outputs `r` (reward).
* **Value Model:** Receives `o` and outputs `v` (value).
* **GAE:** Generalized Advantage Estimation, receives `r` and `v`.
* **A:** Action.
* `KL`: Kullback-Leibler divergence.
* **GRPO Section (Bottom):**
* `q`: Input query.
* **Policy Model:** Processes `q` and outputs `o1` to `oG` (observations).
* **Reference Model:** Receives `o1` to `oG` and contributes to the calculation of `KL` divergence.
* **Reward Model:** Receives `o1` to `oG` and outputs `r1` to `rG` (rewards).
* **Group Computation:** Processes `r1` to `rG`.
* **A1` to `AG`: Actions.
* `KL`: Kullback-Leibler divergence.
* **Labels:**
* "PPO" - Label for the top section.
* "GRPO" - Label for the bottom section.
* "Trained Models" - Label for the output of the PPO section.
* "Frozen Models" - Label for the output of the GRPO section.
### Detailed Analysis or Content Details
**PPO Section:**
The PPO section shows a single-path data flow. The input `q` goes to the Policy Model, which generates an observation `o`. This observation is then fed into the Reference, Reward, and Value Models. The Reward Model outputs `r`, and the Value Model outputs `v`. These are used by the GAE to produce an action `A`. The KL divergence is calculated using the Reference Model and is combined with `r` via addition. The arrows indicate a sequential flow of information.
**GRPO Section:**
The GRPO section demonstrates a grouped approach. The input `q` goes to the Policy Model, which generates a series of observations `o1` through `oG`. These observations are fed into the Reference, Reward Models, producing rewards `r1` through `rG`. These rewards are then processed by the "Group Computation" block, which outputs actions `A1` through `AG`. The KL divergence is calculated using the Reference Model. The dotted line between the PPO and GRPO sections suggests a conceptual link or comparison.
### Key Observations
* The GRPO architecture introduces a grouping mechanism, processing multiple observations and rewards in parallel before generating actions.
* The PPO architecture operates on a single observation-reward-action cycle.
* The "Group Computation" block in GRPO is a key differentiator, suggesting a method for aggregating information across multiple observations.
* The labels "Trained Models" and "Frozen Models" indicate that PPO models are continuously updated during training, while GRPO models are fixed after an initial training phase.
### Interpretation
The diagram illustrates a fundamental difference in how PPO and GRPO handle data during reinforcement learning. PPO employs a standard policy gradient approach, updating its policy based on individual experiences. GRPO, on the other hand, leverages a group-based approach, potentially improving sample efficiency and stability by aggregating information across multiple observations. The "Frozen Models" label for GRPO suggests that the algorithm might be designed for scenarios where computational resources are limited or where a pre-trained model needs to be adapted to a new environment without extensive retraining. The dotted line between the two sections highlights the conceptual relationship, suggesting GRPO can be seen as an extension or modification of the PPO algorithm. The use of KL divergence in both models indicates a common goal of preventing drastic policy changes during training. The diagram is a high-level architectural overview and does not provide specific details about the implementation of the models or the group computation process.