## Diagram: Relative Magnitude Comparison
### Overview
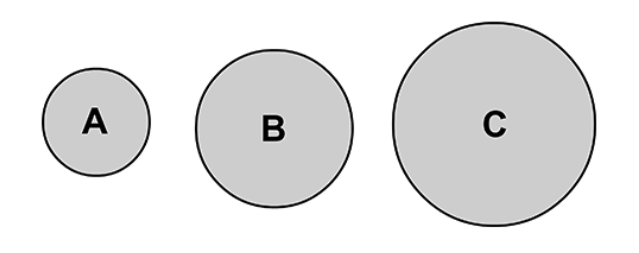
The image displays three circular shapes arranged horizontally, representing a progression in size. The circles are labeled "A", "B", and "C" respectively, indicating an ordered sequence of increasing magnitude.
### Components
* **Shapes:** Three circles of varying diameters.
* **Labels:** Single uppercase letters ("A", "B", "C") centered within each circle.
* **Styling:** All circles share a uniform light gray fill and a black outline. The labels are rendered in a black, sans-serif typeface.
### Detailed Analysis
The diagram is organized linearly from left to right. There are no numerical axes or legends provided; therefore, the data is qualitative rather than quantitative.
* **Circle A (Left):** This is the smallest circle in the set. It contains the label "A".
* **Circle B (Center):** This circle is larger than Circle A but smaller than Circle C. It contains the label "B".
* **Circle C (Right):** This is the largest circle in the set. It contains the label "C".
**Visual Trend:**
The diameter of the circles increases consistently from left to right. The visual weight and surface area of the shapes grow as the alphabetical label progresses (A < B < C).
### Key Observations
* **Ordered Sequence:** The arrangement implies a hierarchy or a progression (e.g., Small, Medium, Large).
* **Uniformity:** Despite the difference in size, the design elements (color, stroke weight, font style) are consistent across all three components, emphasizing that the only variable being communicated is the size/magnitude.
### Interpretation
This diagram serves as a visual metaphor for relative scale.
* **Data Representation:** It demonstrates a qualitative relationship where "C" represents the highest magnitude and "A" represents the lowest.
* **Contextual Usage:** Such diagrams are commonly used in technical documentation, UI/UX design, or educational materials to illustrate concepts like "Small/Medium/Large" sizing, increasing levels of complexity, or hierarchical importance.
* **Peircean Investigative:** The use of the letters A, B, and C acts as an indexical signifier, mapping the alphabetical order to the physical size. The viewer is conditioned to interpret the left-to-right progression as a logical sequence, suggesting that the diagram is not merely a collection of shapes, but a structured set where the properties of the objects are defined by their position and size relative to one another.