## Line Chart: Mean Pass Rate vs. Mean Number of Tokens Generated
### Overview
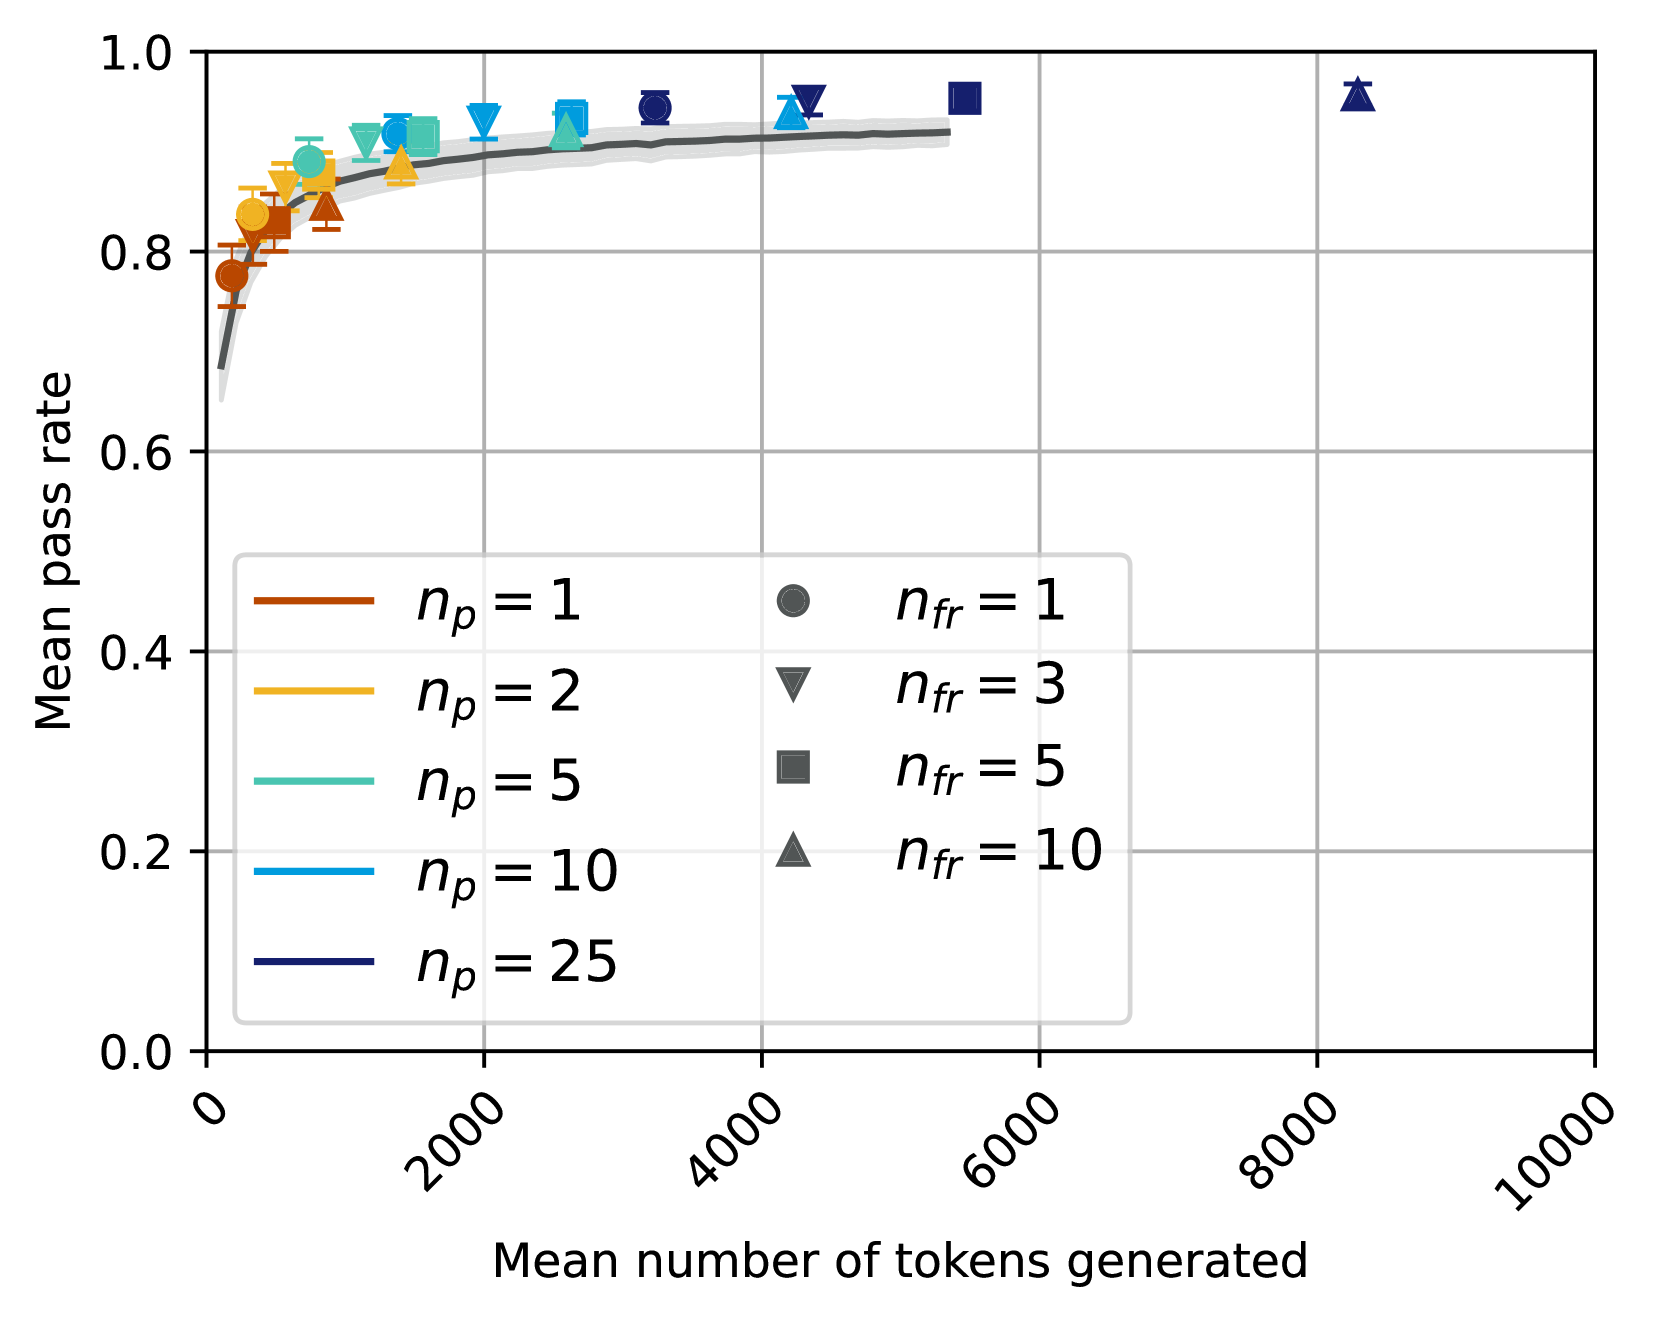
The image is a line chart that plots the mean pass rate against the mean number of tokens generated. There are multiple data series, each representing a different configuration of parameters denoted as 'np' and 'nfr'. The chart shows how the pass rate changes as the number of tokens increases for various parameter settings.
### Components/Axes
* **X-axis:** Mean number of tokens generated. The scale ranges from 0 to 10000, with tick marks at intervals of 2000.
* **Y-axis:** Mean pass rate. The scale ranges from 0.0 to 1.0, with tick marks at intervals of 0.2.
* **Legend (Left):** Located on the left side of the chart. It identifies the lines corresponding to different values of 'np':
* Brown line: np = 1
* Yellow line: np = 2
* Teal line: np = 5
* Light Blue line: np = 10
* Dark Blue line: np = 25
* **Legend (Right):** Located on the right side of the chart. It identifies the markers corresponding to different values of 'nfr':
* Dark Gray circle: nfr = 1
* Dark Gray downward-pointing triangle: nfr = 3
* Dark Gray square: nfr = 5
* Dark Gray upward-pointing triangle: nfr = 10
* A gray shaded region exists, which likely represents a confidence interval or standard deviation around an underlying trend line.
### Detailed Analysis
* **np = 1 (Brown Line):** Starts at approximately 0.7, rises sharply, and plateaus around 0.85 after 2000 tokens.
* Data point at approximately (100, 0.78)
* Data point at approximately (1000, 0.84)
* **np = 2 (Yellow Line):** Starts at approximately 0.75, rises sharply, and plateaus around 0.87 after 2000 tokens.
* Data point at approximately (100, 0.75)
* Data point at approximately (1000, 0.86)
* **np = 5 (Teal Line):** Starts at approximately 0.8, rises sharply, and plateaus around 0.9 after 2000 tokens.
* Data point at approximately (100, 0.80)
* Data point at approximately (1000, 0.88)
* **np = 10 (Light Blue Line):** Starts at approximately 0.8, rises sharply, and plateaus around 0.92 after 2000 tokens.
* Data point at approximately (100, 0.80)
* Data point at approximately (1000, 0.90)
* **np = 25 (Dark Blue Line):** Starts at approximately 0.8, rises sharply, and plateaus around 0.95 after 2000 tokens.
* Data point at approximately (100, 0.80)
* Data point at approximately (1000, 0.92)
* **nfr = 1 (Dark Gray Circle):** Data points are scattered, generally increasing with the number of tokens.
* Data point at approximately (100, 0.78)
* Data point at approximately (1000, 0.84)
* Data point at approximately (4000, 0.94)
* **nfr = 3 (Dark Gray Downward-Pointing Triangle):** Data points are scattered, generally increasing with the number of tokens.
* Data point at approximately (1000, 0.92)
* Data point at approximately (2000, 0.92)
* Data point at approximately (4000, 0.94)
* **nfr = 5 (Dark Gray Square):** Data points are scattered, generally increasing with the number of tokens.
* Data point at approximately (2000, 0.92)
* Data point at approximately (6000, 0.96)
* **nfr = 10 (Dark Gray Upward-Pointing Triangle):** Data points are scattered, generally increasing with the number of tokens.
* Data point at approximately (2000, 0.90)
* Data point at approximately (8000, 0.97)
* The gray shaded region appears to represent the confidence interval for the mean pass rate. It is wider at the beginning of the curve and narrows as the number of tokens increases.
### Key Observations
* The mean pass rate generally increases with the mean number of tokens generated.
* The rate of increase diminishes as the number of tokens increases, suggesting a saturation effect.
* Higher values of 'np' generally lead to higher mean pass rates.
* The 'nfr' values are scattered and do not show a clear trend.
* The confidence interval narrows as the number of tokens increases, indicating more consistent results with a larger number of tokens.
### Interpretation
The chart suggests that increasing the number of tokens generated generally improves the mean pass rate, but the improvement diminishes as the number of tokens gets larger. The parameter 'np' seems to have a positive correlation with the mean pass rate, meaning that higher values of 'np' lead to better performance. The parameter 'nfr' does not show a clear trend, suggesting that it may not have a significant impact on the mean pass rate or that its effect is more complex and requires further investigation. The narrowing confidence interval indicates that the results become more consistent with a larger number of tokens, which is expected.