\n
## Line Chart: Mean Pass Rate vs. Mean Number of Tokens Generated
### Overview
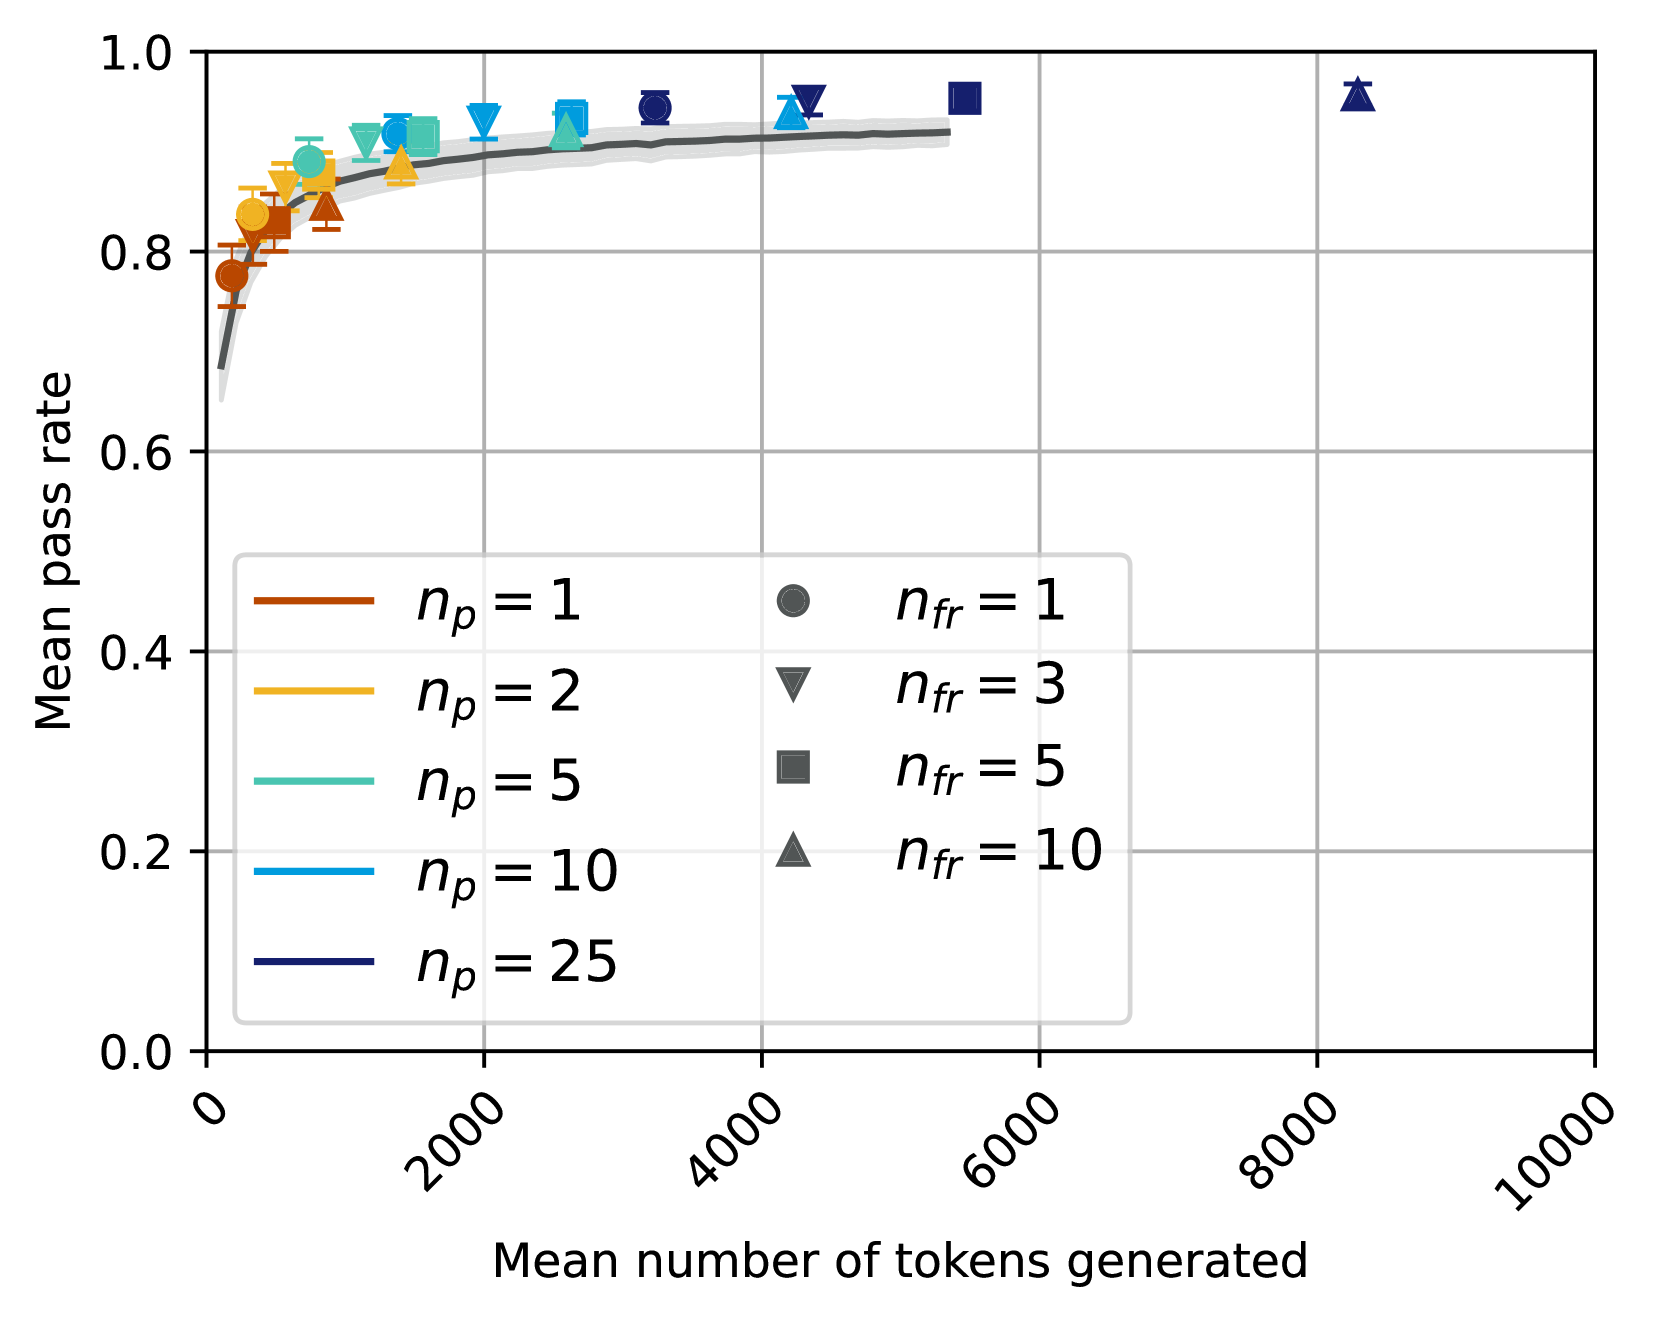
This chart displays the relationship between the mean pass rate and the mean number of tokens generated, with different lines representing different values of *n<sub>p</sub>* (presumably a parameter related to prompt engineering or model configuration) and different markers representing different values of *n<sub>fr</sub>* (likely related to feedback or reinforcement). The chart shows how the pass rate changes as the number of tokens generated increases, for various parameter settings.
### Components/Axes
* **X-axis:** Mean number of tokens generated, ranging from 0 to 10000, with tick marks at 0, 2000, 4000, 6000, 8000, and 10000.
* **Y-axis:** Mean pass rate, ranging from 0.0 to 1.0, with tick marks at 0.0, 0.2, 0.4, 0.6, 0.8, and 1.0.
* **Lines:** Represent different values of *n<sub>p</sub>*: 1 (orange), 2 (yellow), 5 (light blue), 10 (teal), and 25 (dark blue).
* **Markers:** Represent different values of *n<sub>fr</sub>*: 1 (gray circle), 3 (gray downward triangle), 5 (dark gray square), and 10 (dark gray upward triangle).
* **Legend:** Located in the bottom-left corner, associating colors with *n<sub>p</sub>* values and marker shapes with *n<sub>fr</sub>* values.
* **Grid:** A light gray grid is present to aid in reading values.
### Detailed Analysis
The chart shows several lines representing different *n<sub>p</sub>* values.
* **n<sub>p</sub> = 1 (Orange):** Starts at approximately 0.75 pass rate at 0 tokens, rises sharply to around 0.85 at 500 tokens, then plateaus around 0.90 from 2000 tokens onwards. Data points are visible at approximately (0, 0.75), (500, 0.85), (2000, 0.90), (4000, 0.90), (6000, 0.90), (8000, 0.90).
* **n<sub>p</sub> = 2 (Yellow):** Starts at approximately 0.78 pass rate at 0 tokens, rises to around 0.88 at 1000 tokens, and then plateaus around 0.92 from 2000 tokens onwards. Data points are visible at approximately (0, 0.78), (1000, 0.88), (2000, 0.92), (4000, 0.92), (6000, 0.92), (8000, 0.92).
* **n<sub>p</sub> = 5 (Light Blue):** Starts at approximately 0.80 pass rate at 0 tokens, rises to around 0.90 at 1000 tokens, and then plateaus around 0.94 from 2000 tokens onwards. Data points are visible at approximately (0, 0.80), (1000, 0.90), (2000, 0.94), (4000, 0.94), (6000, 0.94), (8000, 0.94).
* **n<sub>p</sub> = 10 (Teal):** Starts at approximately 0.82 pass rate at 0 tokens, rises to around 0.92 at 1000 tokens, and then plateaus around 0.96 from 2000 tokens onwards. Data points are visible at approximately (0, 0.82), (1000, 0.92), (2000, 0.96), (4000, 0.96), (6000, 0.96), (8000, 0.96).
* **n<sub>p</sub> = 25 (Dark Blue):** Starts at approximately 0.84 pass rate at 0 tokens, rises to around 0.94 at 1000 tokens, and then plateaus around 0.98 from 2000 tokens onwards. Data points are visible at approximately (0, 0.84), (1000, 0.94), (2000, 0.98), (4000, 0.98), (6000, 0.98), (8000, 0.98).
Markers representing *n<sub>fr</sub>* values are overlaid on the lines.
* **n<sub>fr</sub> = 1 (Gray Circle):** Visible at approximately (0, 0.75), (2000, 0.90), (4000, 0.90), (6000, 0.90), (8000, 0.90).
* **n<sub>fr</sub> = 3 (Gray Downward Triangle):** Visible at approximately (0, 0.78), (2000, 0.92), (4000, 0.92), (6000, 0.92), (8000, 0.92).
* **n<sub>fr</sub> = 5 (Dark Gray Square):** Visible at approximately (0, 0.80), (2000, 0.94), (4000, 0.94), (6000, 0.94), (8000, 0.94).
* **n<sub>fr</sub> = 10 (Dark Gray Upward Triangle):** Visible at approximately (0, 0.82), (2000, 0.96), (4000, 0.96), (6000, 0.96), (8000, 0.96).
### Key Observations
* The pass rate generally increases with the number of tokens generated, but the rate of increase diminishes after approximately 2000 tokens.
* Higher values of *n<sub>p</sub>* consistently result in higher pass rates.
* Higher values of *n<sub>fr</sub>* consistently result in higher pass rates.
* The lines converge as the number of tokens generated increases, suggesting a saturation point where further token generation does not significantly improve the pass rate.
* The markers for different *n<sub>fr</sub>* values appear to follow the corresponding *n<sub>p</sub>* lines, indicating that the effect of *n<sub>fr</sub>* is consistent across different *n<sub>p</sub>* values.
### Interpretation
The data suggests that increasing the number of tokens generated can improve the pass rate, but there are diminishing returns. The parameter *n<sub>p</sub>* appears to be a key factor in determining the pass rate, with higher values leading to better performance. The parameter *n<sub>fr</sub>* also positively influences the pass rate.
The convergence of the lines at higher token counts indicates that there is a limit to how much the pass rate can be improved by simply generating more tokens. This suggests that other factors, such as the quality of the generated content or the effectiveness of the prompting strategy, may become more important at higher token counts.
The consistent effect of *n<sub>fr</sub>* across different *n<sub>p</sub>* values suggests that it represents a general mechanism for improving performance, independent of the specific prompting strategy. This could relate to a feedback loop or reinforcement learning process. The data points at 8000 tokens for n<sub>p</sub>=25 show a pass rate of approximately 0.98, indicating a very high level of performance.