## Heatmap: Mean Passage Rate
### Overview
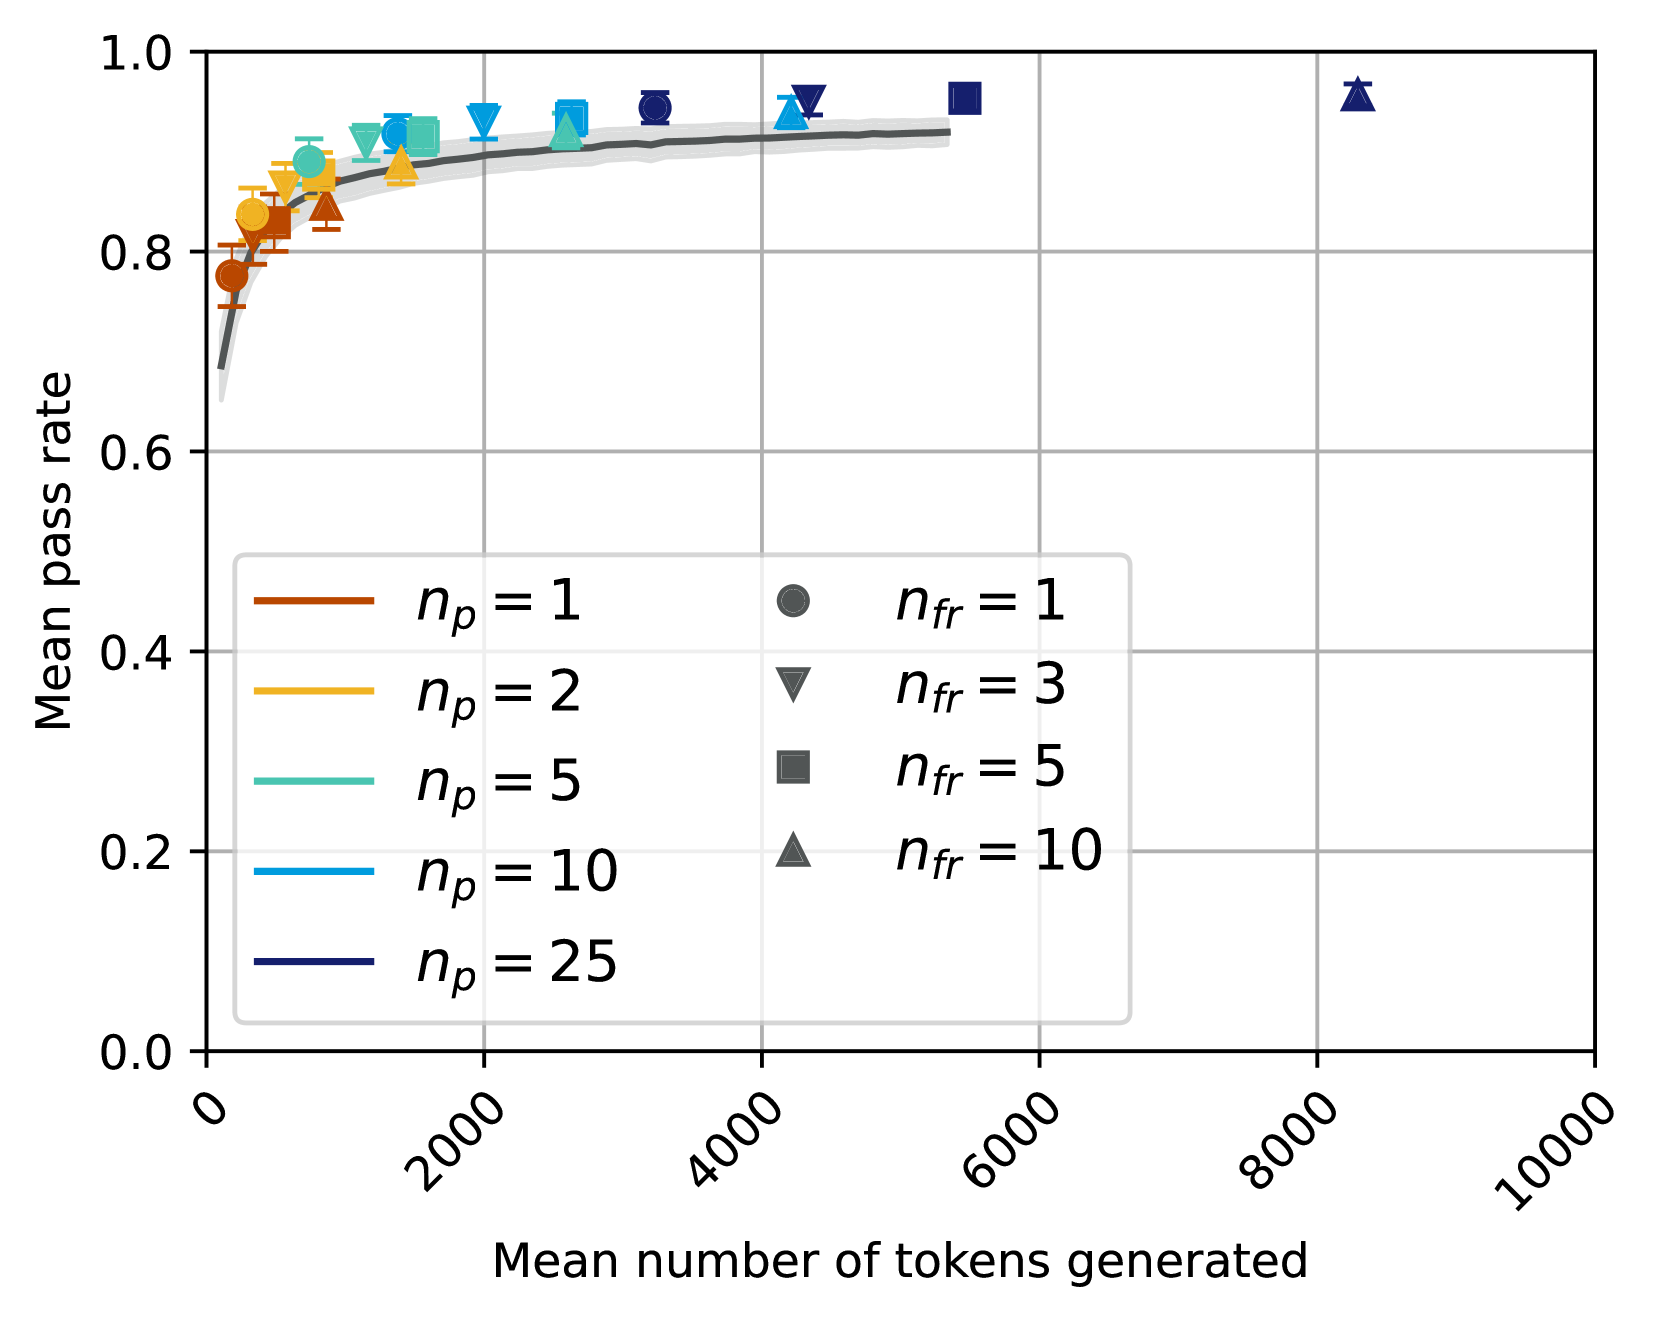
The heatmap illustrates the mean passage rate of different models as the mean number of tokens generated increases. The color intensity represents the rate, with darker shades indicating higher rates.
### Components/Axes
- **X-axis**: Mean number of tokens generated, ranging from 0 to 10,000.
- **Y-axis**: Mean passage rate, ranging from 0.0 to 1.0.
- **Legend**:
- **n_p = 1**: Dark orange
- **n_p = 2**: Light orange
- **n_p = 5**: Yellow
- **n_p = 10**: Light blue
- **n_p = 25**: Dark blue
- **n_fr = 1**: Dark gray
- **n_fr = 3**: Light gray
- **n_fr = 5**: Medium gray
- **n_fr = 10**: Dark gray
- **n_fr = 25**: Light gray
### Detailed Analysis or ### Content Details
- **n_p = 1**: The model with the least number of parameters (1) shows a relatively stable mean passage rate, peaking around 80% at around 2,000 tokens generated.
- **n_p = 2**: This model has a slightly higher mean passage rate compared to n_p = 1, peaking around 85% at around 2,000 tokens generated.
- **n_p = 5**: The model with 5 parameters shows a steady increase in mean passage rate, reaching around 90% at around 10,000 tokens generated.
- **n_p = 10**: This model has the highest mean passage rate, peaking around 95% at around 10,000 tokens generated.
- **n_p = 25**: The model with the most parameters (25) shows the highest mean passage rate, peaking around 98% at around 10,000 tokens generated.
### Key Observations
- There is a clear trend of increasing mean passage rate with the number of parameters.
- The model with the most parameters (n_p = 25) consistently outperforms the others.
- The model with the least number of parameters (n_p = 1) shows the least performance.
### Interpretation
The heatmap suggests that increasing the number of parameters in a model generally leads to a higher mean passage rate. This is consistent with the idea that more parameters allow the model to learn more complex patterns and relationships in the data. The model with the most parameters (n_p = 25) demonstrates the best performance, indicating that it has learned the most from the training data. This finding is significant for the development of language models, as it suggests that larger models may be more effective in generating coherent and contextually appropriate responses.