## Line Graph: Mean Pass Rate vs. Mean Number of Tokens Generated
### Overview
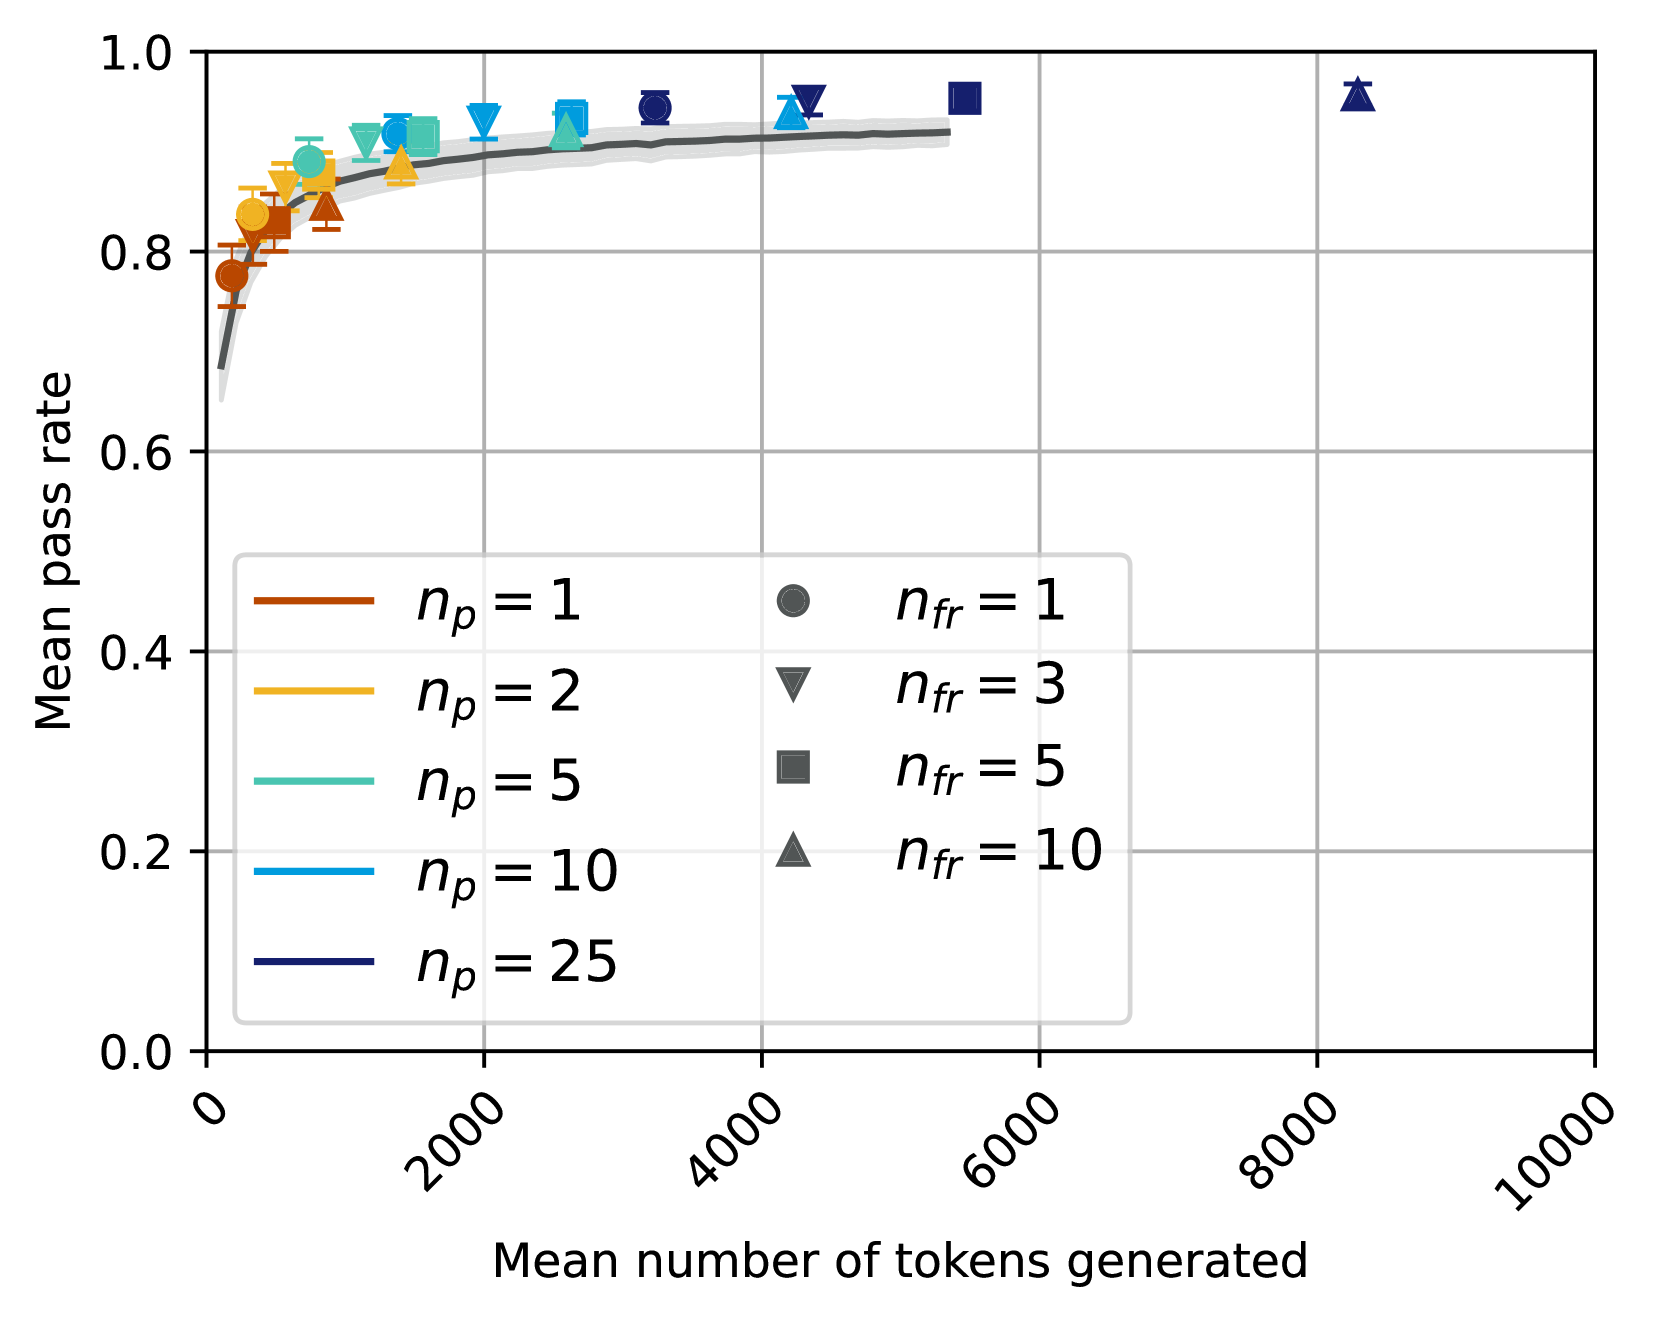
The image is a line graph comparing the **mean pass rate** (y-axis) to the **mean number of tokens generated** (x-axis) across multiple data series. Each series is differentiated by **np** (number of parameters) and **nfr** (number of function calls), with distinct colors and markers. The graph includes a shaded region around the primary data series, likely representing confidence intervals or variability.
### Components/Axes
- **X-axis**: "Mean number of tokens generated" (range: 0 to 10,000).
- **Y-axis**: "Mean pass rate" (range: 0.0 to 1.0).
- **Legend**: Located in the bottom-left corner, mapping:
- **np = 1**: Red line with circular markers.
- **np = 2**: Orange line with triangular markers.
- **np = 5**: Teal line with square markers.
- **np = 10**: Blue line with triangular markers.
- **np = 25**: Dark blue line with square markers.
- **nfr = 1**: Red line (same as np=1).
- **nfr = 3**: Orange line (same as np=2).
- **nfr = 5**: Teal line (same as np=5).
- **nfr = 10**: Blue line (same as np=10).
### Detailed Analysis
1. **np = 1 (Red, Circles)**:
- Starts at ~0.8 pass rate at 2,000 tokens, rising to ~0.95 at 6,000 tokens.
- Shaded region spans ~0.75–0.95, indicating variability.
2. **np = 2 (Orange, Triangles)**:
- Begins at ~0.85 at 2,000 tokens, reaching ~0.98 at 6,000 tokens.
- Shaded region spans ~0.8–0.98.
3. **np = 5 (Teal, Squares)**:
- Starts at ~0.9 at 2,000 tokens, peaking at ~0.99 at 6,000 tokens.
- Shaded region spans ~0.85–0.99.
4. **np = 10 (Blue, Triangles)**:
- Begins at ~0.92 at 2,000 tokens, stabilizing at ~0.995 at 6,000 tokens.
- Shaded region spans ~0.9–0.995.
5. **np = 25 (Dark Blue, Squares)**:
- Starts at ~0.95 at 2,000 tokens, reaching ~0.998 at 6,000 tokens.
- Shaded region spans ~0.93–0.998.
6. **nfr = 10 (Blue, Triangles)**:
- A single data point at ~9,000 tokens with a pass rate of ~0.99.
### Key Observations
- **Trend**: Higher **np** values correlate with higher mean pass rates. The **np = 25** series achieves the highest performance, while **np = 1** lags behind.
- **Convergence**: All series plateau near 1.0 pass rate as tokens increase, suggesting diminishing returns beyond ~6,000 tokens.
- **Shaded Regions**: Wider variability for lower **np** values (e.g., np=1 has a broader shaded area than np=25).
- **Outlier**: The **nfr = 10** data point (blue triangle) at ~9,000 tokens is isolated, with no other markers in that range.
### Interpretation
The graph demonstrates that increasing the number of parameters (**np**) improves the mean pass rate, particularly at lower token counts. However, the performance gains plateau as tokens increase, indicating that beyond a certain threshold (e.g., 6,000 tokens), additional parameters yield minimal improvements. The shaded regions highlight that lower **np** values exhibit greater variability in results, while higher **np** values show more consistent performance. The isolated **nfr = 10** data point suggests a potential anomaly or a specific experimental condition not reflected in other series. This data could inform optimization strategies for balancing computational resources (tokens) and model complexity (parameters) in token generation tasks.