## Comparative Diagram: Image Perturbation Examples
### Overview
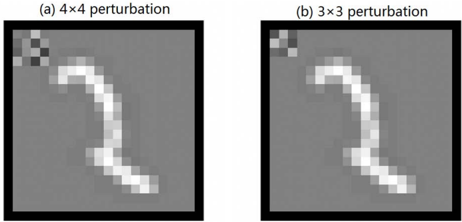
The image displays two side-by-side grayscale panels, each showing a handwritten digit "1" on a uniform gray background. The panels are labeled to indicate they demonstrate different sizes of localized image perturbations applied to the top-left corner of the digit image. This is likely from a technical context related to image processing, machine learning, or adversarial examples.
### Components/Axes
* **Panel Layout:** Two rectangular image panels arranged horizontally.
* **Panel Labels:**
* Left Panel: `(a) 4×4 perturbation`
* Right Panel: `(b) 3×3 perturbation`
* **Image Content (Common to Both):**
* **Background:** A uniform, medium-gray field.
* **Central Figure:** A white, pixelated representation of the handwritten digit "1". The digit has a slight curve at the top and a straight vertical stem.
* **Perturbation Region:** A small, square, pixelated pattern located in the top-left corner of each image panel, separate from the digit.
* **Perturbation Details:**
* **Panel (a):** The perturbation is a 4-pixel by 4-pixel grid. The pattern appears as a checkerboard or alternating sequence of lighter and darker gray pixels.
* **Panel (b):** The perturbation is a 3-pixel by 3-pixel grid. The pattern is simpler, with a central darker pixel surrounded by lighter pixels.
### Detailed Analysis
* **Spatial Grounding:** The perturbation is consistently placed in the **top-left quadrant** of each image panel, well above and to the left of the digit "1". The digit itself is centered vertically and horizontally within the remaining space.
* **Component Isolation:**
* **Header Region:** Contains the text labels `(a) 4×4 perturbation` and `(b) 3×3 perturbation` above their respective images.
* **Main Image Region:** Contains the gray background, the white digit "1", and the corner perturbation.
* **Footer Region:** None present.
* **Visual Comparison:** The digit "1" appears identical in shape, position, and pixel intensity in both panels. The sole variable is the size and pattern of the corner perturbation. The 4x4 perturbation in (a) is visibly larger and has a more complex internal pattern than the 3x3 perturbation in (b).
### Key Observations
1. **Isolated Perturbation:** The perturbations are strictly confined to the top-left corner and do not overlap with or alter the central digit "1".
2. **Controlled Variable:** The experiment or demonstration isolates the perturbation size (4x4 vs. 3x3) as the independent variable, while keeping the target digit and background constant.
3. **Pixel-Level Detail:** The images are low-resolution, making the individual pixels of both the digit and the perturbations clearly visible.
### Interpretation
This diagram serves as a visual comparison of two different localized image perturbations. In technical fields like machine learning, such perturbations are often used to test the robustness of image classification models (e.g., against adversarial attacks) or to study the effects of noise.
* **What it demonstrates:** It shows that a specific, structured noise pattern can be added to an image at different scales (4x4 vs. 3x3 pixels) without affecting the primary subject (the digit "1").
* **Relationship between elements:** The labels directly describe the key difference between the two otherwise nearly identical images. The perturbations are the focal point of the comparison.
* **Underlying purpose:** The image likely aims to illustrate a concept where the *size* of a localized disturbance is a parameter of interest. The clarity of the digit despite the perturbations suggests the noise is designed to be subtle or to test model sensitivity to specific, small-scale changes rather than to obscure the image content. The choice of a simple digit "1" provides a clear, unambiguous baseline for such a test.