## Image Analysis: Perturbation Visualization
### Overview
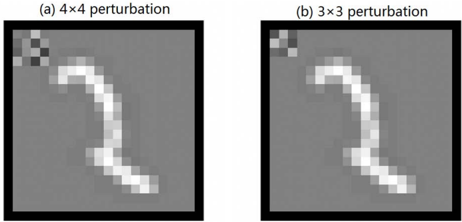
The image contains two side-by-side panels labeled **(a) 4×4 perturbation** and **(b) 3×3 perturbation**, each displaying a blurred, curved white line on a gray background. Both panels feature a small checkerboard pattern in the top-left corner. The visual differences between the panels suggest varying degrees of perturbation intensity or resolution.
---
### Components/Axes
- **Labels**:
- Panel (a): "4×4 perturbation" (top-left text)
- Panel (b): "3×3 perturbation" (top-left text)
- **Background**:
- Uniform gray in both panels.
- Checkerboard pattern (black-and-white squares) in the top-left corner of each panel.
- **Primary Visual Element**:
- A curved, pixelated white line resembling a distorted waveform or path.
- No explicit axes, scales, or legends are present.
---
### Detailed Analysis
1. **Checkerboard Pattern**:
- Positioned in the top-left corner of both panels.
- Likely represents a reference region, mask, or area of interest (e.g., perturbation origin).
- No textual labels or annotations within the checkerboard.
2. **Perturbation Lines**:
- **Panel (a) 4×4 perturbation**:
- Line appears more jagged and fragmented.
- Higher spatial resolution (4×4 grid) results in sharper, more defined distortions.
- Line curvature is pronounced, with visible "kinks" and irregularities.
- **Panel (b) 3×3 perturbation**:
- Line is smoother and less fragmented.
- Lower spatial resolution (3×3 grid) produces a blurred, averaged effect.
- Curvature is less pronounced, with rounded transitions.
3. **Spatial Grounding**:
- Checkerboard is consistently placed in the **top-left** of both panels.
- Perturbation lines occupy the central and lower regions of each panel.
- No overlapping elements or additional annotations.
---
### Key Observations
- **Resolution Impact**: The 4×4 perturbation (a) exhibits greater detail and sharper distortions compared to the 3×3 perturbation (b), which appears smoothed due to lower resolution.
- **Checkerboard Consistency**: The identical checkerboard pattern in both panels suggests it serves as a fixed reference point, possibly indicating the perturbation's origin or a control region.
- **Line Continuity**: Both lines share a similar general shape (curved, diagonal trajectory), but the 4×4 perturbation introduces more localized deviations.
---
### Interpretation
The image likely demonstrates the effect of perturbation size on a visual or signal-processing task. The 4×4 perturbation introduces finer, more localized distortions, while the 3×3 perturbation averages these effects, resulting in a smoother output. The checkerboard pattern may represent a masked region or a baseline for comparison. This could relate to applications such as:
- **Image compression artifacts**: Comparing how different grid resolutions affect distortion visibility.
- **Noise injection in machine learning**: Testing model robustness to varying perturbation intensities.
- **Signal processing**: Analyzing how resolution impacts the representation of curved paths or waveforms.
The absence of numerical data or explicit axes limits quantitative analysis, but the visual contrast between panels highlights the trade-off between resolution and smoothness in perturbation modeling.