## Line Chart: Bitcoin Price Over Time
### Overview
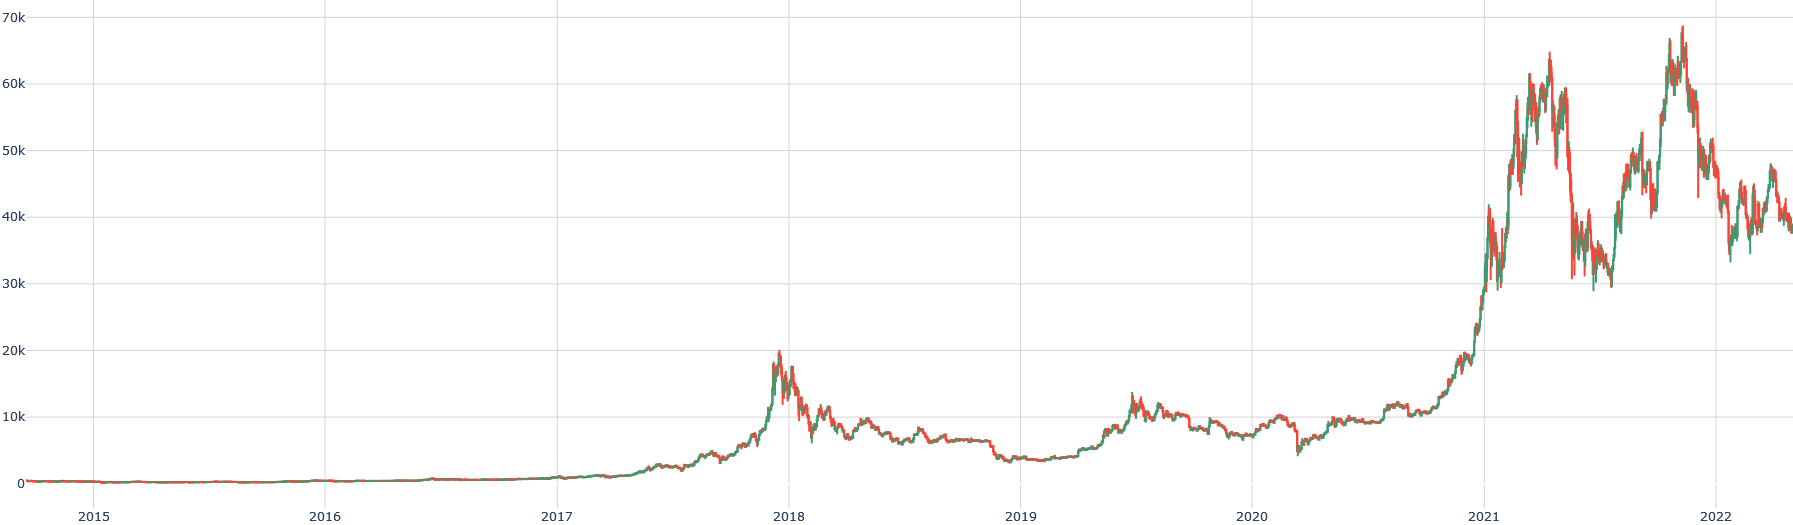
The image is a line chart showing the price of Bitcoin over time, from 2015 to 2022. The chart displays the price fluctuations in Bitcoin, with significant increases and decreases over the years. The chart uses two lines, one green and one red, which appear to overlap closely, suggesting they represent similar data or perhaps high and low values for each day.
### Components/Axes
* **X-axis:** Represents time, labeled with years from 2015 to 2022.
* **Y-axis:** Represents the price of Bitcoin, with values ranging from 0 to 70k (presumably USD). The scale is marked at intervals of 10k (0, 10k, 20k, 30k, 40k, 50k, 60k, 70k).
* **Data Series:** Two lines, one green and one red, that closely follow each other, indicating the price fluctuations. There is no explicit legend, but the lines likely represent daily high and low prices.
### Detailed Analysis
* **2015-2017:** The price remains relatively stable and close to 0.
* **2017-2018:** A significant increase occurs, peaking around 20k in early 2018, followed by a sharp decline.
* **2018-2020:** The price fluctuates between approximately 5k and 10k.
* **2020-2021:** A massive surge begins in late 2020, reaching a peak of approximately 65k-70k in 2021.
* **2021-2022:** The price experiences high volatility, with multiple peaks and dips, generally trending downward from the 2021 high. The price ends around 40k in 2022.
**Specific Data Points (Approximate):**
* **2015:** Price near 0.
* **Early 2018:** Peak around 20k.
* **2019-2020:** Fluctuating between 5k and 10k.
* **Late 2021:** Peak around 65k-70k.
* **2022:** Ends around 40k.
### Key Observations
* The most significant price increase occurred between 2020 and 2021.
* The price is highly volatile, especially after 2020.
* The green and red lines are very close, suggesting they represent a daily range.
### Interpretation
The chart illustrates the dramatic rise and fall of Bitcoin's price over a relatively short period. The initial stability from 2015-2017 is followed by periods of rapid growth and subsequent corrections. The volatility observed after 2020 indicates a more mature, yet still highly speculative, market. The close proximity of the green and red lines suggests that while the price fluctuates daily, the overall trend is consistent. The data suggests that Bitcoin is a high-risk, high-reward investment, subject to significant market fluctuations.