## Combined Chart: Atom Number Distribution
### Overview
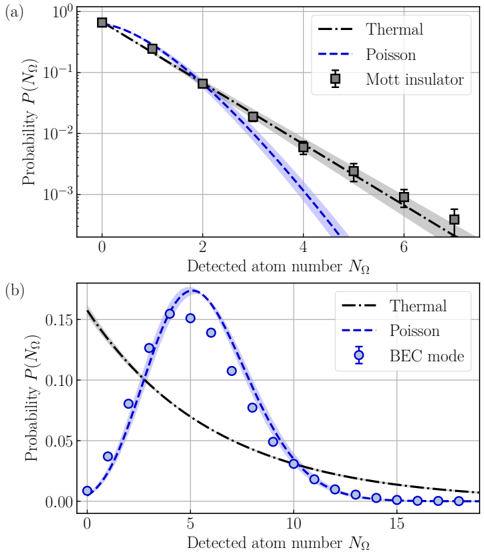
The image presents two plots, (a) and (b), showing the probability distribution P(NΩ) of detected atom numbers NΩ under different conditions. Plot (a) compares a Mott insulator distribution with thermal and Poisson distributions on a semi-log scale. Plot (b) compares a BEC mode distribution with thermal and Poisson distributions on a linear scale.
### Components/Axes
**Plot (a):**
* **Title:** (a) (top-left)
* **X-axis:** Detected atom number NΩ, ranging from 0 to 7.
* **Y-axis:** Probability P(NΩ), ranging from 10^-3 to 10^0 (logarithmic scale).
* **Legend (top-right):**
* Thermal (black dashed-dotted line)
* Poisson (blue dashed line)
* Mott insulator (gray squares with error bars)
**Plot (b):**
* **Title:** (b) (top-left)
* **X-axis:** Detected atom number NΩ, ranging from 0 to 19.
* **Y-axis:** Probability P(NΩ), ranging from 0.00 to 0.15 (linear scale).
* **Legend (top-right):**
* Thermal (black dashed-dotted line)
* Poisson (blue dashed line)
* BEC mode (blue circles with error bars)
### Detailed Analysis
**Plot (a): Mott Insulator, Thermal, and Poisson Distributions**
* **Mott insulator (gray squares):** The data points are approximately:
* (0, 0.8)
* (1, 0.3)
* (2, 0.08)
* (3, 0.03)
* (4, 0.01)
* (5, 0.004)
* (6, 0.001)
* (7, 0.0003)
The Mott insulator distribution shows a decreasing probability with increasing atom number. The gray shaded area around the Mott insulator data points represents the uncertainty.
* **Thermal (black dashed-dotted line):** The thermal distribution follows a similar decreasing trend as the Mott insulator, but is slightly higher at larger atom numbers.
* **Poisson (blue dashed line):** The Poisson distribution decreases more rapidly than the Mott insulator and thermal distributions. It falls below the Mott insulator data after NΩ = 2. The blue shaded area around the Poisson line represents the uncertainty.
**Plot (b): BEC Mode, Thermal, and Poisson Distributions**
* **BEC mode (blue circles):** The data points are approximately:
* (0, 0.02)
* (2, 0.08)
* (4, 0.14)
* (5, 0.15)
* (6, 0.14)
* (8, 0.08)
* (10, 0.05)
* (12, 0.02)
* (14, 0.01)
* (16, 0.005)
* (18, 0.002)
The BEC mode distribution shows a peak around NΩ = 5. The blue shaded area around the Poisson line represents the uncertainty.
* **Thermal (black dashed-dotted line):** The thermal distribution starts high and decreases monotonically with increasing atom number.
* **Poisson (blue dashed line):** The Poisson distribution shows a peak around NΩ = 5, similar to the BEC mode, but the peak is sharper and the distribution decays faster.
### Key Observations
* In plot (a), the Mott insulator distribution is broader than the Poisson distribution.
* In plot (b), the BEC mode distribution is similar to the Poisson distribution but has a slightly broader peak.
* The thermal distribution decreases monotonically in both plots.
### Interpretation
The plots illustrate the probability distributions of detected atom numbers for different quantum states. Plot (a) shows that the Mott insulator distribution is broader than the Poisson distribution, indicating a more uniform distribution of atoms across lattice sites. Plot (b) shows that the BEC mode distribution is similar to the Poisson distribution, but with a broader peak, suggesting a less coherent state than a pure Bose-Einstein condensate. The thermal distribution represents a classical, incoherent state, which is characterized by a monotonically decreasing probability with increasing atom number. The shaded regions around the Poisson distribution in both plots, and the Mott insulator data in plot (a), represent the uncertainty in the measurements or theoretical calculations.