## Chart: Probability Distributions of Detected Atom Numbers
### Overview
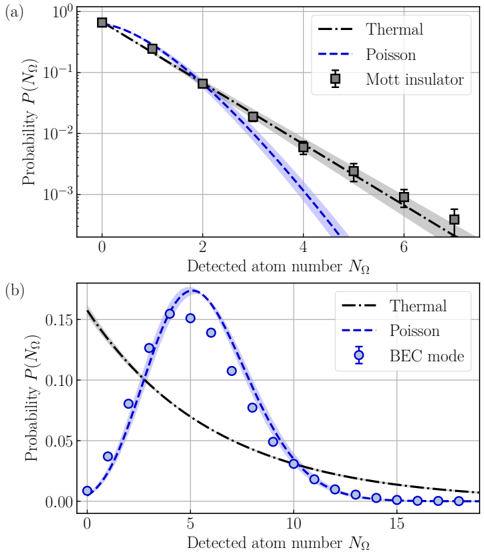
The image displays two sub-charts, labeled (a) and (b), which compare experimental probability distributions of detected atom numbers ($N_\Omega$) against theoretical models. Chart (a) utilizes a logarithmic y-axis to illustrate the exponential decay characteristic of a "Mott insulator" state compared to "Thermal" and "Poisson" models. Chart (b) utilizes a linear y-axis to illustrate the peaked distribution of a "BEC mode" (Bose-Einstein Condensate) compared to the same theoretical models.
### Components/Axes
**Chart (a)**
* **Y-Axis:** Logarithmic scale, ranging from $10^{-3}$ to $10^0$. Label: "Probability $P(N_\Omega)$".
* **X-Axis:** Linear scale, ranging from 0 to 7. Label: "Detected atom number $N_\Omega$".
* **Legend (Top-Right):**
* "Thermal": Black dash-dot line.
* "Poisson": Blue dash line.
* "Mott insulator": Grey square markers with vertical error bars.
**Chart (b)**
* **Y-Axis:** Linear scale, ranging from 0.00 to 0.15. Label: "Probability $P(N_\Omega)$".
* **X-Axis:** Linear scale, ranging from 0 to 15. Label: "Detected atom number $N_\Omega$".
* **Legend (Top-Right):**
* "Thermal": Black dash-dot line.
* "Poisson": Blue dash line.
* "BEC mode": Blue circle markers with vertical error bars.
---
### Detailed Analysis
#### Chart (a): Mott Insulator Statistics
* **Visual Trend:** The "Thermal" model (black dash-dot) and the "Mott insulator" data points exhibit a linear downward slope on the logarithmic scale, indicating an exponential decay in probability as the atom number increases. The "Poisson" model (blue dash) shows a much steeper, non-linear drop-off.
* **Data Points (Mott insulator):**
* $N_\Omega = 0$: $P \approx 0.7$
* $N_\Omega = 1$: $P \approx 0.25$
* $N_\Omega = 2$: $P \approx 0.07$
* $N_\Omega = 3$: $P \approx 0.02$
* $N_\Omega = 4$: $P \approx 0.006$
* $N_\Omega = 5$: $P \approx 0.0025$
* $N_\Omega = 6$: $P \approx 0.001$
* $N_\Omega = 7$: $P \approx 0.0004$
* **Observation:** The "Mott insulator" data points align closely with the "Thermal" model, which is surrounded by a shaded grey region representing uncertainty or confidence intervals.
#### Chart (b): BEC Mode Statistics
* **Visual Trend:** The "Thermal" model shows a monotonic decay. The "Poisson" model and "BEC mode" data points exhibit a bell-shaped curve (distribution) peaking around $N_\Omega = 5$.
* **Data Points (BEC mode):**
* $N_\Omega = 0$: $P \approx 0.01$
* $N_\Omega = 1$: $P \approx 0.04$
* $N_\Omega = 2$: $P \approx 0.08$
* $N_\Omega = 3$: $P \approx 0.13$
* $N_\Omega = 4$: $P \approx 0.155$
* $N_\Omega = 5$: $P \approx 0.15$
* $N_\Omega = 6$: $P \approx 0.14$
* $N_\Omega = 7$: $P \approx 0.11$
* $N_\Omega = 8$: $P \approx 0.08$
* $N_\Omega = 9$: $P \approx 0.05$
* $N_\Omega = 10$: $P \approx 0.03$
* **Observation:** The "BEC mode" data points follow the general shape of the "Poisson" curve but appear slightly broader and shifted, with the peak slightly lower than the theoretical Poisson peak.
---
### Key Observations
1. **Statistical Divergence:** The two charts demonstrate fundamentally different statistical behaviors for the two quantum states. The Mott insulator is characterized by thermal statistics (exponential decay), while the BEC mode is characterized by Poissonian statistics (peaked distribution).
2. **Model Consistency:** The "Thermal" and "Poisson" theoretical lines are consistent across both plots, serving as a control to validate the experimental data.
3. **Data Fit:** In chart (a), the Mott insulator data fits the Thermal model extremely well. In chart (b), the BEC mode data shows a slight deviation from the ideal Poisson curve, likely due to experimental broadening or finite-size effects in the BEC.
### Interpretation
This figure provides experimental evidence distinguishing the statistical nature of two quantum phases.
* **Chart (a)** demonstrates that the Mott insulator state behaves like a thermal gas, where the probability of detecting $N$ atoms decreases exponentially. This is typical for systems with large fluctuations in particle number.
* **Chart (b)** demonstrates that the BEC mode exhibits Poissonian statistics. This is a hallmark of a coherent state, where the particle number distribution is narrower and centered around a mean value, contrasting sharply with the thermal distribution.
The juxtaposition of these two plots effectively visualizes the transition from thermal/chaotic statistics to coherent/ordered statistics in quantum gas experiments.