## [Two-Panel Line Graph]: Probability Distributions of Detected Atom Numbers for Different Quantum States
### Overview
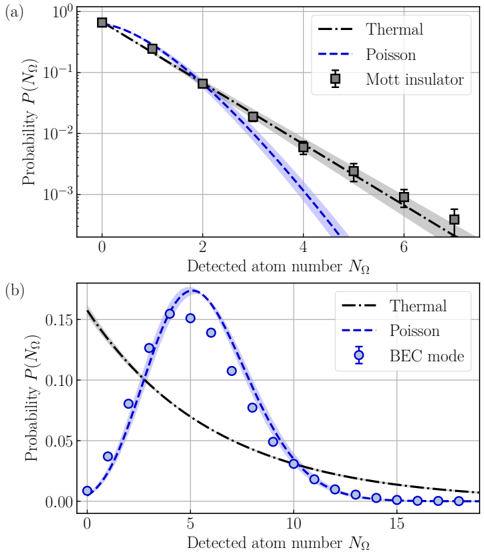
The image contains two vertically stacked line graphs, labeled (a) and (b), comparing the probability distributions of detected atom numbers (`N_Ω`) for different physical states: Thermal, Poisson, Mott insulator, and BEC (Bose-Einstein Condensate) mode. Plot (a) uses a logarithmic probability scale, while plot (b) uses a linear scale.
### Components/Axes
**Common Elements:**
* **X-axis (both plots):** Label: `Detected atom number N_Ω`. Plot (a) range: 0 to 7. Plot (b) range: 0 to 18.
* **Y-axis (both plots):** Label: `Probability P(N_Ω)`.
* Plot (a): Logarithmic scale from `10^-3` to `10^0`.
* Plot (b): Linear scale from `0.00` to `0.15`.
* **Legends:**
* Plot (a) - Top-right corner:
* `Thermal`: Black dash-dotted line (`-.-`).
* `Poisson`: Blue dashed line (`--`) with a light blue shaded uncertainty band.
* `Mott insulator`: Black square markers (`□`) with vertical error bars.
* Plot (b) - Top-right corner:
* `Thermal`: Black dash-dotted line (`-.-`).
* `Poisson`: Blue dashed line (`--`).
* `BEC mode`: Blue circle markers (`○`) with vertical error bars.
### Detailed Analysis
**Plot (a) - Logarithmic Scale:**
* **Trend Verification:** All three series show a decreasing trend as the detected atom number `N_Ω` increases. The `Poisson` distribution decreases more steeply than the `Thermal` distribution.
* **Data Points & Values (Approximate):**
* At `N_Ω = 0`: All three series start at a high probability, ~`0.8`.
* At `N_Ω = 2`: `Thermal` and `Mott insulator` are ~`0.07`. `Poisson` is slightly lower, ~`0.06`.
* At `N_Ω = 4`: `Thermal` and `Mott insulator` are ~`0.006`. `Poisson` is ~`0.001`.
* At `N_Ω = 6`: `Thermal` is ~`0.001`. `Mott insulator` is ~`0.001` (with error bar spanning ~`0.0005` to `0.002`). `Poisson` is below `10^-3` (off the plotted line trend).
* **Component Isolation:** The `Mott insulator` data points (black squares) closely follow the `Thermal` distribution line across the entire range, with slight deviations at higher `N_Ω`.
**Plot (b) - Linear Scale:**
* **Trend Verification:** The `Thermal` distribution decreases monotonically. The `Poisson` distribution is bell-shaped, peaking around `N_Ω = 5`. The `BEC mode` data points follow the `Poisson` curve.
* **Data Points & Values (Approximate):**
* **Poisson/BEC Mode Peak:** At `N_Ω = 5`, the `Poisson` line peaks at ~`0.17`. The `BEC mode` data point at `N_Ω = 5` is ~`0.155`.
* **Thermal Line:** At `N_Ω = 0`, ~`0.16`. At `N_Ω = 5`, ~`0.08`. At `N_Ω = 10`, ~`0.02`.
* **BEC Mode Data:** Closely matches the `Poisson` curve. For example, at `N_Ω = 2`, ~`0.04`; at `N_Ω = 8`, ~`0.09`; at `N_Ω = 12`, ~`0.01`.
* At high atom numbers (`N_Ω > 15`), both the `Thermal` and `Poisson` distributions, as well as the `BEC mode` data, approach a probability of `0.00`.
### Key Observations
1. **State-Dependent Distributions:** The `Mott insulator` state (plot a) exhibits a probability distribution nearly identical to the `Thermal` distribution. In contrast, the `BEC mode` state (plot b) exhibits a distribution nearly identical to the `Poisson` distribution.
2. **Scale Revelation:** The logarithmic scale in (a) clearly shows the exponential decay of the Thermal and Mott insulator distributions and highlights the divergence of the Poisson distribution at higher atom numbers. The linear scale in (b) clearly reveals the characteristic peak of the Poisson/BEC mode distribution.
3. **Data Agreement:** The experimental data points (`Mott insulator` and `BEC mode`) show strong agreement with their respective theoretical distribution lines (`Thermal` and `Poisson`), within the shown error bars.
### Interpretation
This figure demonstrates a fundamental difference in the atom number statistics of two quantum phases of matter.
* The **Mott insulator** phase, characterized by a fixed number of atoms per lattice site, shows **super-Poissonian** or thermal-like number fluctuations, as its distribution matches the `Thermal` curve. This suggests a higher degree of randomness or "bunching" in the detected atoms.
* The **BEC mode**, representing a coherent quantum state, shows **Poissonian** number fluctuations. This is the hallmark of a coherent state (like a laser), where the variance in particle number equals the mean. The data confirms that the BEC mode's statistics are consistent with this fundamental quantum optical model.
* The comparison underscores how measuring atom number distributions can serve as a diagnostic tool to identify and characterize different quantum phases in ultracold atomic systems. The clear separation between the Thermal and Poisson curves in plot (b) provides a distinct signature for identifying a coherent BEC versus a thermal gas.