## Line Graphs: Probability Distributions of Detected Atom Numbers
### Overview
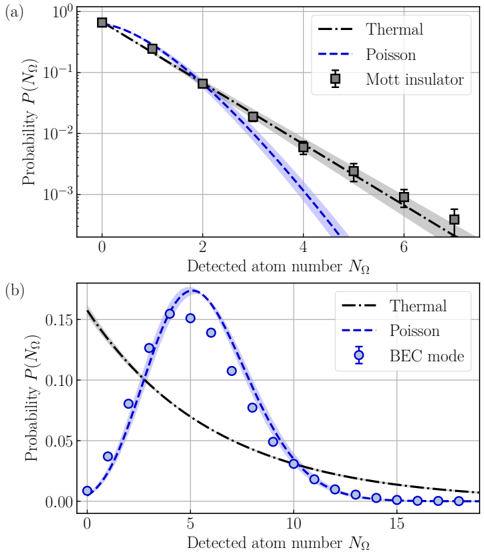
The image contains two line graphs (a) and (b) comparing probability distributions of detected atom numbers (N_Ω) under different theoretical models (Thermal, Poisson) and experimental modes (Mott insulator, BEC mode). Both graphs use logarithmic and linear scales for probability (P(N_Ω)) and linear scales for N_Ω, respectively.
---
### Components/Axes
#### Graph (a)
- **Y-axis**: Probability P(N_Ω) (logarithmic scale: 10⁻³ to 10⁰)
- **X-axis**: Detected atom number N_Ω (linear scale: 0 to 6)
- **Legend**:
- Dashed black line: Thermal distribution
- Dashed blue line: Poisson distribution
- Gray squares with error bars: Mott insulator experimental data
- **Legend Position**: Top-right corner
#### Graph (b)
- **Y-axis**: Probability P(N_Ω) (linear scale: 0 to 0.15)
- **X-axis**: Detected atom number N_Ω (linear scale: 0 to 15)
- **Legend**:
- Dashed black line: Thermal distribution
- Dashed blue line: Poisson distribution
- Blue circles with error bars: BEC mode experimental data
- **Legend Position**: Top-right corner
---
### Detailed Analysis
#### Graph (a)
- **Thermal Distribution**:
- Dashed black line decreases monotonically from ~10⁰ at N_Ω=0 to ~10⁻³ at N_Ω=6.
- No shaded region.
- **Poisson Distribution**:
- Dashed blue line decreases similarly to Thermal but with a shaded blue region (likely confidence interval) around it.
- Shaded region widens at lower N_Ω (0–2), indicating higher uncertainty.
- **Mott Insulator Data**:
- Gray squares with error bars align closely with the Poisson line.
- Error bars increase in size at lower N_Ω (e.g., ±0.1 at N_Ω=0, ±0.05 at N_Ω=6).
#### Graph (b)
- **Thermal Distribution**:
- Dashed black line decreases monotonically from ~0.15 at N_Ω=0 to ~0.005 at N_Ω=15.
- **Poisson Distribution**:
- Dashed blue line peaks at N_Ω=5 (~0.12) and decreases afterward.
- No shaded region.
- **BEC Mode Data**:
- Blue circles with error bars align with the Poisson peak at N_Ω=5.
- Error bars are smaller at higher N_Ω (e.g., ±0.01 at N_Ω=10, ±0.02 at N_Ω=15).
---
### Key Observations
1. **Graph (a)**:
- Mott insulator data closely follows the Poisson distribution, suggesting Poissonian statistics dominate at low N_Ω.
- Thermal distribution deviates slightly at higher N_Ω but remains close to Poisson.
- Shaded region around Poisson in (a) implies greater uncertainty at low N_Ω.
2. **Graph (b)**:
- BEC mode data peaks at N_Ω=5, matching the Poisson distribution’s maximum.
- Thermal distribution declines steadily without a peak, contrasting with Poisson/BEC mode.
- Error bars in BEC mode are smaller at higher N_Ω, indicating more precise measurements.
---
### Interpretation
- **Poisson vs. Thermal**: The Poisson distribution (dashed blue) consistently aligns with experimental data (Mott insulator in (a), BEC mode in (b)), suggesting quantum systems exhibit Poissonian statistics, likely due to coherent state behavior or shot noise.
- **Thermal Distribution**: The dashed black line represents a classical thermal model, which diverges from experimental results, indicating quantum effects dominate over thermal noise.
- **Shaded Regions**: In (a), the shaded area around Poisson highlights uncertainty in low-N_Ω measurements, possibly due to experimental limitations or quantum fluctuations.
- **BEC Mode Peak**: The sharp peak in BEC mode data at N_Ω=5 (graph b) mirrors the Poisson distribution’s maximum, reinforcing the role of quantum coherence in atom number statistics.
---
### Notable Trends
- **Low-N_Ω Uncertainty**: Larger error bars at N_Ω=0–2 in graph (a) suggest challenges in detecting small atom numbers.
- **High-N_Ω Precision**: Smaller error bars at N_Ω>10 in graph (b) indicate improved measurement accuracy for larger atom numbers.
- **Model Agreement**: Experimental data (Mott/BEC) closely follow Poisson predictions, validating the theoretical model for these systems.
---
### Conclusion
The graphs demonstrate that quantum systems (Mott insulator, BEC mode) exhibit Poissonian statistics for detected atom numbers, contrasting with classical thermal models. The shaded regions and error bars emphasize experimental uncertainties, particularly at low N_Ω. These results highlight the dominance of quantum coherence over thermal noise in these systems.