## Bar Charts: Question and Answer Token Frequency Distribution
### Overview
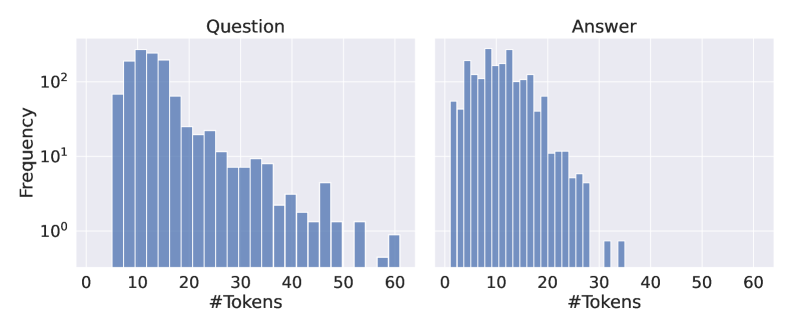
The image contains two side-by-side bar charts comparing the frequency distribution of token counts for "Questions" and "Answers." Both charts use a logarithmic scale (base 10) for the y-axis (Frequency) and a linear scale for the x-axis (#Tokens). The x-axis ranges from 0 to 60 tokens, while the y-axis spans 10⁰ to 10². The charts reveal distinct patterns in token usage between questions and answers.
### Components/Axes
- **X-axis (Horizontal):**
- Label: `#Tokens`
- Scale: Linear, 0–60 tokens, with ticks at 10-unit intervals (0, 10, 20, ..., 60).
- **Y-axis (Vertical):**
- Label: `Frequency`
- Scale: Logarithmic (10⁰ to 10²), with gridlines at 1, 10, and 100.
- **Chart Titles:**
- Left chart: `Question`
- Right chart: `Answer`
- **Bars:**
- Color: Blue (no legend present; titles act as identifiers).
### Detailed Analysis
#### Question Chart
- **Trend:**
- Frequency peaks at ~10 tokens (~100 occurrences).
- Gradual decline as token count increases, with frequencies dropping below 10⁰ (~1 occurrence) by 50–60 tokens.
- **Key Data Points:**
- 10 tokens: ~100 frequency
- 20 tokens: ~50 frequency
- 30 tokens: ~20 frequency
- 40 tokens: ~10 frequency
- 50 tokens: ~5 frequency
#### Answer Chart
- **Trend:**
- Higher peak frequency (~150 occurrences) at 10 tokens compared to questions.
- Steeper decline: frequencies drop below 10⁰ by 30–40 tokens.
- **Key Data Points:**
- 10 tokens: ~150 frequency
- 20 tokens: ~100 frequency
- 30 tokens: ~50 frequency
- 40 tokens: ~10 frequency
- 50 tokens: ~5 frequency
### Key Observations
1. **Similar Distribution Shape:** Both charts exhibit a right-skewed distribution, with most tokens concentrated at lower values (10–20 tokens).
2. **Higher Answer Frequencies:** Answers consistently show higher frequencies than questions for equivalent token counts (e.g., 10 tokens: 150 vs. 100).
3. **Rapid Decline:** Both distributions drop sharply after 20 tokens, indicating rare use of longer sequences.
4. **Logarithmic Scale Impact:** The y-axis compression emphasizes differences in low-frequency ranges (e.g., 1–10 tokens).
### Interpretation
- **Token Usage Patterns:**
- Questions and answers are predominantly concise, with most instances requiring ≤20 tokens.
- Answers may require slightly more tokens on average, as evidenced by their higher peak frequency at 10 tokens.
- **Implications:**
- The logarithmic scale highlights the dominance of short sequences, suggesting efficiency in token usage for both question and answer generation.
- The steeper decline in answers implies stricter constraints on response length compared to questions.
- **Anomalies:**
- No significant outliers; both distributions follow predictable decay patterns.
- The absence of data beyond 40 tokens in answers suggests a hard cutoff or truncation in the dataset.
This analysis underscores the importance of token efficiency in natural language processing tasks, with answers demonstrating marginally higher complexity than questions within the same token budget.