## Diagram: Hypothesis Plausibility based on Observations
### Overview
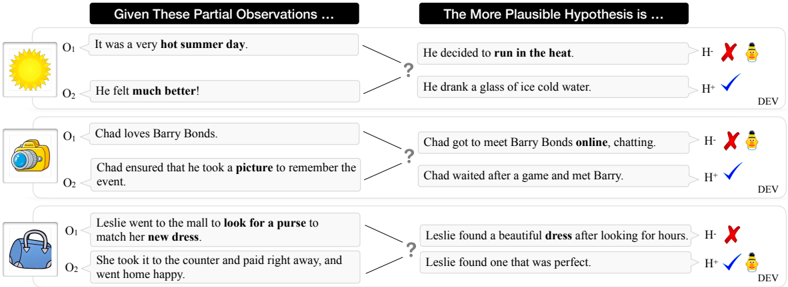
The image presents a diagram comparing partial observations with plausible hypotheses. It explores whether a given hypothesis aligns with the provided observations, marking each hypothesis as either supported (H+) or unsupported (H-). The diagram is divided into three distinct scenarios, each presenting two observations and two potential hypotheses.
### Components/Axes
* **Title (Left):** "Given These Partial Observations ..."
* **Title (Right):** "The More Plausible Hypothesis is ..."
* **Observation Labels:** O1, O2 (for each scenario)
* **Hypothesis Labels:** H+, H- (for each hypothesis)
* **Scenario 1:**
* **Observation 1 (O1):** "It was a very hot summer day." (Associated with a sun icon)
* **Observation 2 (O2):** "He felt much better!"
* **Hypothesis 1:** "He decided to run in the heat."
* **Hypothesis 2:** "He drank a glass of ice cold water."
* **Scenario 2:**
* **Observation 1 (O1):** "Chad loves Barry Bonds." (Associated with a camera icon)
* **Observation 2 (O2):** "Chad ensured that he took a picture to remember the event."
* **Hypothesis 1:** "Chad got to meet Barry Bonds online, chatting."
* **Hypothesis 2:** "Chad waited after a game and met Barry."
* **Scenario 3:**
* **Observation 1 (O1):** "Leslie went to the mall to look for a purse to match her new dress." (Associated with a purse icon)
* **Observation 2 (O2):** "She took it to the counter and paid right away, and went home happy."
* **Hypothesis 1:** "Leslie found a beautiful dress after looking for hours."
* **Hypothesis 2:** "Leslie found one that was perfect."
* **Icons:**
* Sun icon (Scenario 1)
* Camera icon (Scenario 2)
* Purse icon (Scenario 3)
* Red X icon (Indicates unsupported hypothesis)
* Blue Checkmark icon (Indicates supported hypothesis)
* Duck icon wearing a graduation cap (next to the red X)
* **Labels:**
* DEV (next to each H+ and H- pair)
### Detailed Analysis or ### Content Details
**Scenario 1:**
* **Observation 1:** "It was a very hot summer day."
* **Observation 2:** "He felt much better!"
* **Hypothesis 1:** "He decided to run in the heat." - Marked as H- (unsupported) with a red X.
* **Hypothesis 2:** "He drank a glass of ice cold water." - Marked as H+ (supported) with a blue checkmark.
**Scenario 2:**
* **Observation 1:** "Chad loves Barry Bonds."
* **Observation 2:** "Chad ensured that he took a picture to remember the event."
* **Hypothesis 1:** "Chad got to meet Barry Bonds online, chatting." - Marked as H- (unsupported) with a red X.
* **Hypothesis 2:** "Chad waited after a game and met Barry." - Marked as H+ (supported) with a blue checkmark.
**Scenario 3:**
* **Observation 1:** "Leslie went to the mall to look for a purse to match her new dress."
* **Observation 2:** "She took it to the counter and paid right away, and went home happy."
* **Hypothesis 1:** "Leslie found a beautiful dress after looking for hours." - Marked as H- (unsupported) with a red X.
* **Hypothesis 2:** "Leslie found one that was perfect." - Marked as H+ (supported) with a blue checkmark.
### Key Observations
* Each scenario presents two observations and two potential hypotheses.
* In each scenario, one hypothesis is marked as supported (H+) and the other as unsupported (H-).
* The supported hypotheses generally align more logically with the given observations.
### Interpretation
The diagram illustrates a basic principle of hypothesis testing: evaluating the plausibility of different explanations based on available evidence. The supported hypotheses are those that provide a more coherent and logical explanation for the given observations. For example, in the first scenario, drinking cold water is a more plausible explanation for feeling better on a hot day than running in the heat. The diagram demonstrates how observations can be used to differentiate between competing hypotheses and select the most likely explanation. The "DEV" label likely indicates that these are examples used for development or demonstration purposes.