\n
## Diagram: Plausible Hypothesis Selection
### Overview
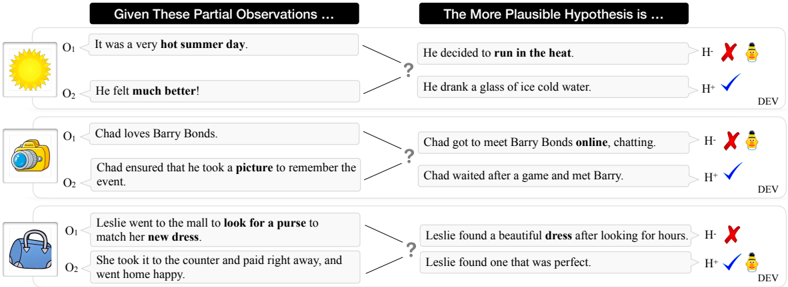
The image presents a diagram illustrating the process of selecting a more plausible hypothesis given partial observations. It consists of three distinct scenarios, each with two observations (O1, O2) and two competing hypotheses (H1, H2). Each hypothesis is evaluated and marked as either supported (H+) or refuted (H-), accompanied by visual cues (icons of a person and a beverage).
### Components/Axes
The diagram is structured into three horizontal sections, each representing a different scenario. Each section is divided into two columns: "Given These Partial Observations..." and "The More Plausible Hypothesis is...".
- **Observations Column:** Contains two observations labeled O1 and O2, accompanied by a small illustrative icon.
- **Hypotheses Column:** Presents two hypotheses (H1 and H2) with a question mark connecting them to the observations. Each hypothesis is marked with either a red "X" (H-) indicating refutation or a green checkmark (H+) indicating support. A small icon of a person and a beverage is also present next to each hypothesis.
### Detailed Analysis or Content Details
**Scenario 1: Hot Summer Day**
- **O1:** "It was a very hot summer day." (Icon: Sun)
- **O2:** "He felt much better!" (No Icon)
- **H1:** "He decided to run in the heat." (Marked H- with red "X" and person/beverage icon)
- **H2:** "He drank a glass of ice cold water." (Marked H+ with green checkmark and person/beverage icon)
**Scenario 2: Chad and Barry Bonds**
- **O1:** "Chad loves Barry Bonds." (Icon: Camera)
- **O2:** "Chad ensured that he took a picture to remember the event." (No Icon)
- **H1:** "Chad got to meet Barry Bonds online, chatting." (Marked H- with red "X" and person/beverage icon)
- **H2:** "Chad waited after a game and met Barry." (Marked H+ with green checkmark and person/beverage icon)
**Scenario 3: Leslie's Purse**
- **O1:** "Leslie went to the mall to look for a purse to match her new dress." (Icon: Handbag)
- **O2:** "She took it to the counter and paid right away, and went home." (No Icon)
- **H1:** "Leslie found a beautiful dress after looking for hours." (Marked H- with red "X" and person/beverage icon)
- **H2:** "Leslie found one that was perfect." (Marked H+ with green checkmark and person/beverage icon)
### Key Observations
- In all three scenarios, one hypothesis is consistently marked as more plausible (H+) while the other is refuted (H-).
- The icons accompanying the hypotheses (person and beverage) appear consistently across all scenarios, suggesting they represent a general indicator of plausibility or a specific element within the evaluation process.
- The observations are presented as factual statements, while the hypotheses are interpretations of those observations.
### Interpretation
The diagram demonstrates a simplified model of Bayesian reasoning or abductive inference. Given a set of observations, the diagram illustrates how to evaluate competing hypotheses and select the one that best explains the available evidence. The "H+" and "H-" markings represent the outcome of this evaluation. The consistent presence of the person/beverage icon suggests it might be a visual cue representing a positive outcome or a reward for selecting the correct hypothesis. The scenarios themselves are designed to be relatable and intuitive, making the concept of hypothesis selection more accessible. The diagram highlights the importance of considering multiple explanations and using evidence to determine the most plausible one. The question mark connecting the observations to the hypotheses visually represents the uncertainty inherent in the process of inference. The diagram is a pedagogical tool for illustrating the core principles of scientific reasoning and critical thinking.