# Technical Document Extraction: Scatter Plot Analysis
## Key Components and Labels
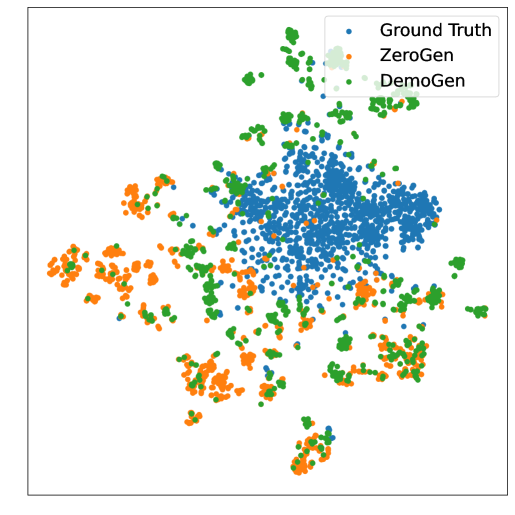
- **Legend**: Located in the top-right corner of the plot.
- **Blue Dots**: Labeled "Ground Truth"
- **Green Dots**: Labeled "ZeroGen"
- **Orange Dots**: Labeled "DemoGen"
## Chart Description
- **Axes**: Unlabeled (no axis titles or markers provided).
- **Data Distribution**:
- **Ground Truth (Blue)**:
- Largest cluster of points.
- Densely packed in the central region of the plot.
- **ZeroGen (Green)**:
- Smaller cluster compared to Ground Truth.
- More dispersed, with points spread across the plot.
- **DemoGen (Orange)**:
- Smallest cluster.
- Points exhibit partial overlap with Ground Truth and ZeroGen clusters.
- Predominantly located in peripheral regions of the plot.
## Observations
1. **Cluster Density**:
- Ground Truth demonstrates the highest density, suggesting it represents the most frequent or central data points.
- ZeroGen and DemoGen show lower densities, indicating sparser distributions.
2. **Overlap**:
- DemoGen points partially overlap with both Ground Truth and ZeroGen clusters, suggesting potential similarities or misclassifications.
3. **Scale**:
- No explicit scale or numerical axis values provided, limiting quantitative analysis.
## Notes
- The plot visually compares three categorical datasets (Ground Truth, ZeroGen, DemoGen) based on their spatial distribution.
- Without axis labels or numerical data, the exact nature of the plotted variables (e.g., features, metrics) remains undefined.