## Heatmap: Classification Accuracies
### Overview
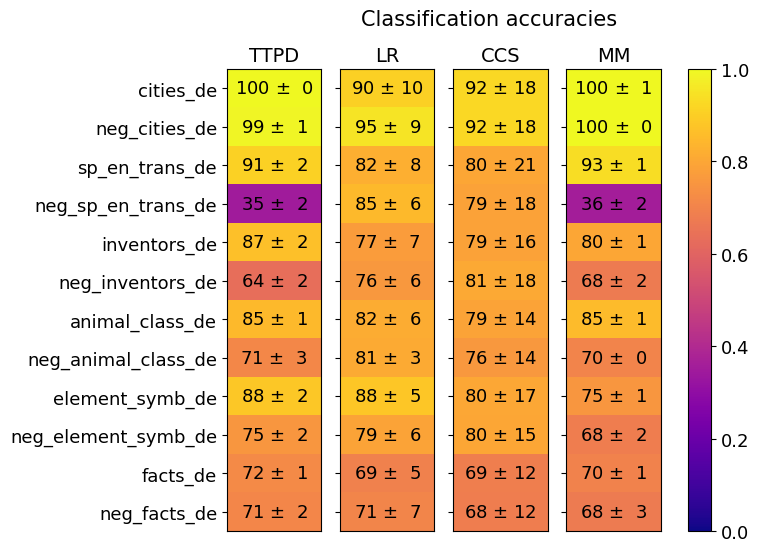
The image is a heatmap displaying classification accuracies for different models (TTPD, LR, CCS, MM) across various categories (e.g., cities_de, neg_cities_de). The heatmap uses a color gradient from dark blue (0.0) to bright yellow (1.0) to represent the accuracy values. Each cell contains the accuracy value and its associated uncertainty (± value).
### Components/Axes
* **Title:** Classification accuracies
* **Columns (Models):** TTPD, LR, CCS, MM
* **Rows (Categories):** cities\_de, neg\_cities\_de, sp\_en\_trans\_de, neg\_sp\_en\_trans\_de, inventors\_de, neg\_inventors\_de, animal\_class\_de, neg\_animal\_class\_de, element\_symb\_de, neg\_element\_symb\_de, facts\_de, neg\_facts\_de
* **Colorbar:** Ranges from 0.0 (dark blue) to 1.0 (bright yellow), representing classification accuracy.
### Detailed Analysis or Content Details
Here's a breakdown of the data, organized by category and model:
* **cities\_de:**
* TTPD: 100 ± 0 (Yellow)
* LR: 90 ± 10 (Yellow)
* CCS: 92 ± 18 (Yellow)
* MM: 100 ± 1 (Yellow)
* **neg\_cities\_de:**
* TTPD: 99 ± 1 (Yellow)
* LR: 95 ± 9 (Yellow)
* CCS: 92 ± 18 (Yellow)
* MM: 100 ± 0 (Yellow)
* **sp\_en\_trans\_de:**
* TTPD: 91 ± 2 (Yellow)
* LR: 82 ± 8 (Orange-Yellow)
* CCS: 80 ± 21 (Orange-Yellow)
* MM: 93 ± 1 (Yellow)
* **neg\_sp\_en\_trans\_de:**
* TTPD: 35 ± 2 (Dark Purple)
* LR: 85 ± 6 (Orange-Yellow)
* CCS: 79 ± 18 (Orange)
* MM: 36 ± 2 (Dark Purple)
* **inventors\_de:**
* TTPD: 87 ± 2 (Orange-Yellow)
* LR: 77 ± 7 (Orange)
* CCS: 79 ± 16 (Orange)
* MM: 80 ± 1 (Orange-Yellow)
* **neg\_inventors\_de:**
* TTPD: 64 ± 2 (Orange)
* LR: 76 ± 6 (Orange)
* CCS: 81 ± 18 (Orange-Yellow)
* MM: 68 ± 2 (Orange)
* **animal\_class\_de:**
* TTPD: 85 ± 1 (Orange-Yellow)
* LR: 82 ± 6 (Orange-Yellow)
* CCS: 79 ± 14 (Orange)
* MM: 85 ± 1 (Orange-Yellow)
* **neg\_animal\_class\_de:**
* TTPD: 71 ± 3 (Orange)
* LR: 81 ± 3 (Orange-Yellow)
* CCS: 76 ± 14 (Orange)
* MM: 70 ± 0 (Orange)
* **element\_symb\_de:**
* TTPD: 88 ± 2 (Orange-Yellow)
* LR: 88 ± 5 (Orange-Yellow)
* CCS: 80 ± 17 (Orange-Yellow)
* MM: 75 ± 1 (Orange)
* **neg\_element\_symb\_de:**
* TTPD: 75 ± 2 (Orange)
* LR: 79 ± 6 (Orange)
* CCS: 80 ± 15 (Orange-Yellow)
* MM: 68 ± 2 (Orange)
* **facts\_de:**
* TTPD: 72 ± 1 (Orange)
* LR: 69 ± 5 (Orange)
* CCS: 69 ± 12 (Orange)
* MM: 70 ± 1 (Orange)
* **neg\_facts\_de:**
* TTPD: 71 ± 2 (Orange)
* LR: 71 ± 7 (Orange)
* CCS: 68 ± 12 (Orange)
* MM: 68 ± 3 (Orange)
### Key Observations
* TTPD and MM models show 100% accuracy for 'cities\_de' and 'neg\_cities\_de'.
* TTPD performs poorly on 'neg\_sp\_en\_trans\_de' compared to other models.
* The uncertainty (± value) varies significantly across models, with CCS generally having higher uncertainty.
* Most categories have accuracies in the orange-yellow range (60-90%), indicating reasonable performance.
### Interpretation
The heatmap provides a comparative view of the classification accuracies of four different models across a range of categories. The TTPD model appears to excel in certain categories (cities), but struggles significantly with 'neg\_sp\_en\_trans\_de'. The LR and CCS models show more consistent performance across categories, although CCS has higher uncertainty. The MM model mirrors TTPD's high performance in the 'cities' categories but also shares its low accuracy in 'neg\_sp\_en\_trans\_de'.
The high uncertainty values for the CCS model suggest that its performance may vary considerably depending on the specific dataset or conditions. The poor performance of TTPD and MM on 'neg\_sp\_en\_trans\_de' could indicate a specific challenge in classifying this type of data, potentially due to its complexity or ambiguity.