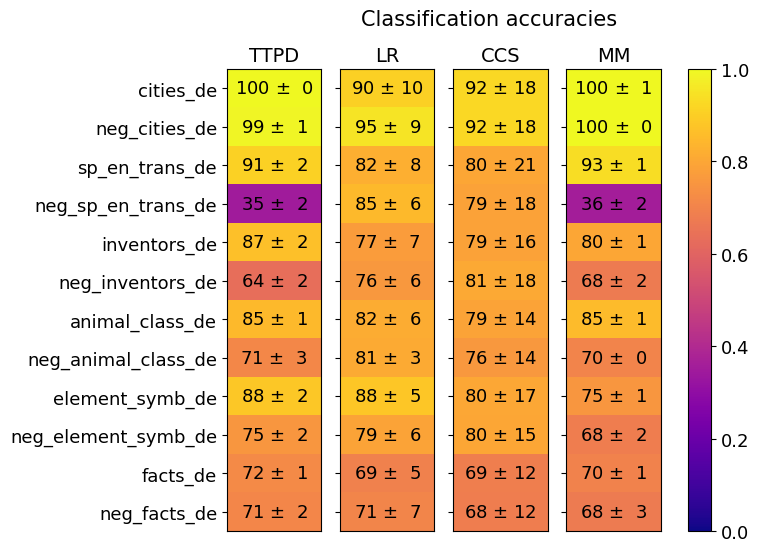
## Heatmap: Classification Accuracies
### Overview
This image presents a heatmap displaying classification accuracies for various datasets and models. The heatmap visualizes the performance of four different models (TTPD, LR, CCS, MM) across twelve different datasets, each with a negative counterpart. The color intensity represents the accuracy, with yellow indicating higher accuracy and blue indicating lower accuracy.
### Components/Axes
* **Title:** "Classification accuracies" (centered at the top)
* **X-axis:** Model names: "TTPD", "LR", "CCS", "MM"
* **Y-axis:** Dataset names:
* "cities\_de"
* "neg\_cities\_de"
* "sp\_en\_trans\_de"
* "neg\_sp\_en\_trans\_de"
* "inventors\_de"
* "neg\_inventors\_de"
* "animal\_class\_de"
* "neg\_animal\_class\_de"
* "element\_symb\_de"
* "neg\_element\_symb\_de"
* "facts\_de"
* "neg\_facts\_de"
* **Color Scale:** A vertical color bar on the right side, ranging from blue (0.0) to yellow (1.0), representing accuracy.
### Detailed Analysis
The heatmap displays accuracy values with standard deviations (±). I will analyze each model's performance across the datasets.
**TTPD (First Column):**
* cities\_de: 100 ± 0
* neg\_cities\_de: 99 ± 1
* sp\_en\_trans\_de: 91 ± 2
* neg\_sp\_en\_trans\_de: 35 ± 2
* inventors\_de: 87 ± 2
* neg\_inventors\_de: 64 ± 2
* animal\_class\_de: 85 ± 1
* neg\_animal\_class\_de: 71 ± 3
* element\_symb\_de: 88 ± 2
* neg\_element\_symb\_de: 75 ± 2
* facts\_de: 72 ± 1
* neg\_facts\_de: 71 ± 2
**LR (Second Column):**
* cities\_de: 90 ± 10
* neg\_cities\_de: 95 ± 9
* sp\_en\_trans\_de: 82 ± 8
* neg\_sp\_en\_trans\_de: 85 ± 6
* inventors\_de: 77 ± 7
* neg\_inventors\_de: 76 ± 6
* animal\_class\_de: 82 ± 6
* neg\_animal\_class\_de: 81 ± 3
* element\_symb\_de: 88 ± 5
* neg\_element\_symb\_de: 79 ± 6
* facts\_de: 69 ± 5
* neg\_facts\_de: 71 ± 7
**CCS (Third Column):**
* cities\_de: 92 ± 18
* neg\_cities\_de: 92 ± 18
* sp\_en\_trans\_de: 80 ± 21
* neg\_sp\_en\_trans\_de: 79 ± 18
* inventors\_de: 79 ± 16
* neg\_inventors\_de: 81 ± 18
* animal\_class\_de: 79 ± 14
* neg\_animal\_class\_de: 76 ± 14
* element\_symb\_de: 80 ± 17
* neg\_element\_symb\_de: 80 ± 15
* facts\_de: 69 ± 12
* neg\_facts\_de: 68 ± 12
**MM (Fourth Column):**
* cities\_de: 100 ± 1
* neg\_cities\_de: 100 ± 0
* sp\_en\_trans\_de: 93 ± 1
* neg\_sp\_en\_trans\_de: 36 ± 2
* inventors\_de: 80 ± 1
* neg\_inventors\_de: 68 ± 2
* animal\_class\_de: 85 ± 1
* neg\_animal\_class\_de: 70 ± 0
* element\_symb\_de: 75 ± 1
* neg\_element\_symb\_de: 68 ± 2
* facts\_de: 70 ± 1
* neg\_facts\_de: 68 ± 3
### Key Observations
* **High Accuracy on "cities\_de" and "neg\_cities\_de":** Both TTPD and MM achieve perfect or near-perfect accuracy (100 ± 0/1) on these datasets.
* **Low Accuracy on "neg\_sp\_en\_trans\_de":** TTPD and MM show significantly lower accuracy (35 ± 2 and 36 ± 2 respectively) on this dataset.
* **Variability in CCS:** The CCS model exhibits the largest standard deviations, particularly for "cities\_de" and "neg\_cities\_de" (±18), suggesting less consistent performance.
* **Negative Dataset Performance:** Generally, the negative datasets ("neg\_...") tend to have lower accuracy scores compared to their positive counterparts.
* **TTPD and MM are generally the best performing models.**
### Interpretation
The heatmap demonstrates the performance of different classification models on a set of datasets, including both original and "negative" versions. The "negative" datasets likely represent some form of adversarial examples or data designed to challenge the models.
The consistently high accuracy of TTPD and MM on the "cities\_de" dataset suggests these models are well-suited for this particular type of data. The significant drop in accuracy for both models on "neg\_sp\_en\_trans\_de" indicates a vulnerability to the specific characteristics of this negative dataset – potentially related to translation or linguistic complexity.
The larger standard deviations observed for CCS suggest that its performance is more sensitive to variations in the data. The overall trend of lower accuracy on negative datasets highlights the importance of robustness and adversarial training in machine learning models. The heatmap provides a clear visual comparison of model strengths and weaknesses across different data scenarios, aiding in model selection and improvement.