## Heatmap: Classification Accuracies
### Overview
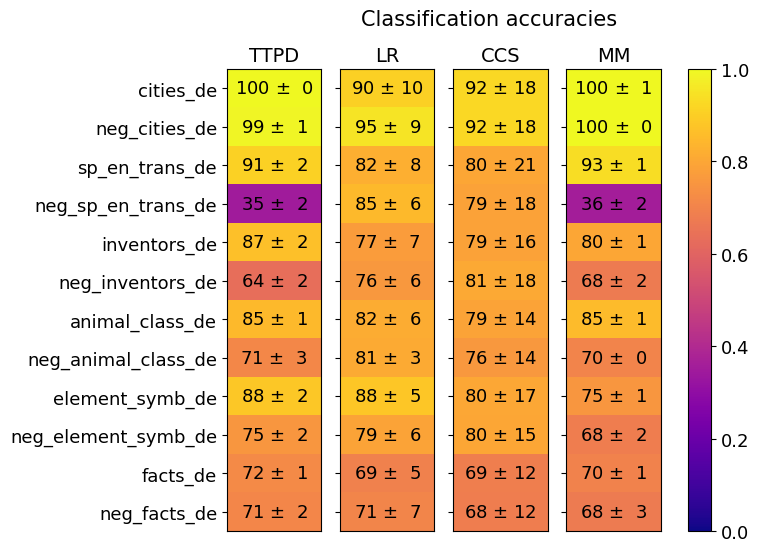
The image is a heatmap titled "Classification accuracies" that displays the performance (accuracy) of four different methods (TTPD, LR, CCS, MM) across twelve distinct datasets. Each cell contains a mean accuracy value followed by a standard deviation (±). The accuracy is visually encoded using a color scale ranging from purple (low accuracy, ~0.0) to yellow (high accuracy, ~1.0).
### Components/Axes
* **Title:** "Classification accuracies" (centered at the top).
* **Row Labels (Datasets):** Listed vertically on the left side. From top to bottom:
1. `cities_de`
2. `neg_cities_de`
3. `sp_en_trans_de`
4. `neg_sp_en_trans_de`
5. `inventors_de`
6. `neg_inventors_de`
7. `animal_class_de`
8. `neg_animal_class_de`
9. `element_symb_de`
10. `neg_element_symb_de`
11. `facts_de`
12. `neg_facts_de`
* **Column Labels (Methods):** Listed horizontally at the top. From left to right:
1. `TTPD`
2. `LR`
3. `CCS`
4. `MM`
* **Color Bar/Legend:** Positioned on the far right. It is a vertical gradient bar mapping color to accuracy values.
* **Scale:** Linear from 0.0 (bottom, dark purple) to 1.0 (top, bright yellow).
* **Tick Marks:** Labeled at 0.0, 0.2, 0.4, 0.6, 0.8, and 1.0.
### Detailed Analysis
The following table reconstructs the data from the heatmap. Values are presented as `Mean ± Standard Deviation`.
| Dataset | TTPD | LR | CCS | MM |
| :--- | :--- | :--- | :--- | :--- |
| **cities_de** | 100 ± 0 | 90 ± 10 | 92 ± 18 | 100 ± 1 |
| **neg_cities_de** | 99 ± 1 | 95 ± 9 | 92 ± 18 | 100 ± 0 |
| **sp_en_trans_de** | 91 ± 2 | 82 ± 8 | 80 ± 21 | 93 ± 1 |
| **neg_sp_en_trans_de** | **35 ± 2** | 85 ± 6 | 79 ± 18 | **36 ± 2** |
| **inventors_de** | 87 ± 2 | 77 ± 7 | 79 ± 16 | 80 ± 1 |
| **neg_inventors_de** | 64 ± 2 | 76 ± 6 | 81 ± 18 | 68 ± 2 |
| **animal_class_de** | 85 ± 1 | 82 ± 6 | 79 ± 14 | 85 ± 1 |
| **neg_animal_class_de** | 71 ± 3 | 81 ± 3 | 76 ± 14 | 70 ± 0 |
| **element_symb_de** | 88 ± 2 | 88 ± 5 | 80 ± 17 | 75 ± 1 |
| **neg_element_symb_de** | 75 ± 2 | 79 ± 6 | 80 ± 15 | 68 ± 2 |
| **facts_de** | 72 ± 1 | 69 ± 5 | 69 ± 12 | 70 ± 1 |
| **neg_facts_de** | 71 ± 2 | 71 ± 7 | 68 ± 12 | 68 ± 3 |
**Visual Trend Verification:**
* **TTPD & MM:** These two methods show a very similar visual pattern. They are predominantly yellow (high accuracy) across most rows, with a dramatic, isolated drop to dark purple for the `neg_sp_en_trans_de` dataset. They also show a moderate dip (orange) for `neg_inventors_de`.
* **LR:** This method displays a more consistent, moderate-to-high accuracy profile (mostly orange to yellow) across all datasets. It does not exhibit the extreme low seen in TTPD/MM for `neg_sp_en_trans_de`.
* **CCS:** This method shows the highest variance in performance, indicated by the large standard deviations in many cells (e.g., ±18, ±21). Its color profile is mixed, with no single dominant trend, but it generally avoids the very low accuracies (purple) seen elsewhere.
### Key Observations
1. **Critical Performance Drop:** The most striking feature is the severe accuracy collapse for methods **TTPD** and **MM** on the `neg_sp_en_trans_de` dataset (35% and 36%, respectively). This is the only instance of dark purple (accuracy < 0.4) in the entire heatmap.
2. **Method Similarity:** TTPD and MM have nearly identical performance profiles, suggesting they may be related algorithms or variants.
3. **Dataset Difficulty:** The `neg_facts_de` and `facts_de` datasets yield the lowest average accuracies across all methods, suggesting they are the most challenging tasks presented.
4. **Stability vs. Peak Performance:** LR offers the most stable performance (lower standard deviations, no extreme lows) but rarely achieves the perfect (100%) scores that TTPD and MM hit on the `cities_de` datasets.
5. **Negation Effect:** For most methods, the `neg_` prefixed version of a dataset often results in lower accuracy than its positive counterpart (e.g., `inventors_de` vs. `neg_inventors_de`), with the exception of the catastrophic failure on `neg_sp_en_trans_de`.
### Interpretation
This heatmap likely compares machine learning or classification models on a series of German-language (`_de` suffix) tasks, some of which involve negation (`neg_` prefix). The data suggests:
* **Task-Specific Failure:** The methods TTPD and MM are highly effective on most tasks but have a specific, severe vulnerability to the `neg_sp_en_trans_de` task. This could indicate a failure mode related to handling negation in the context of Spanish-English translation data (`sp_en_trans`), which the other methods (LR, CCS) handle more robustly.
* **Trade-off Between Consistency and Peak Accuracy:** LR appears to be a reliable, general-purpose method, while TTPD/MM are "high-risk, high-reward" – capable of perfect accuracy on some tasks but prone to dramatic failure on others.
* **The Challenge of Negation and Facts:** The consistently lower scores on `facts_de` and `neg_facts_de` imply that factual knowledge retrieval or verification is a harder problem for these models than classification of cities, animals, or symbols.
* **Model Correlation:** The near-identical performance of TTPD and MM strongly implies they share a core architecture or training methodology. An investigator would want to compare their underlying designs to understand this correlation.
**Language Note:** All dataset labels contain the suffix `_de`, which is a common abbreviation for "Deutsch" (German). This indicates the datasets are likely in the German language or pertain to German-language tasks.