## Line Chart: Accuracy vs. Sample Size
### Overview
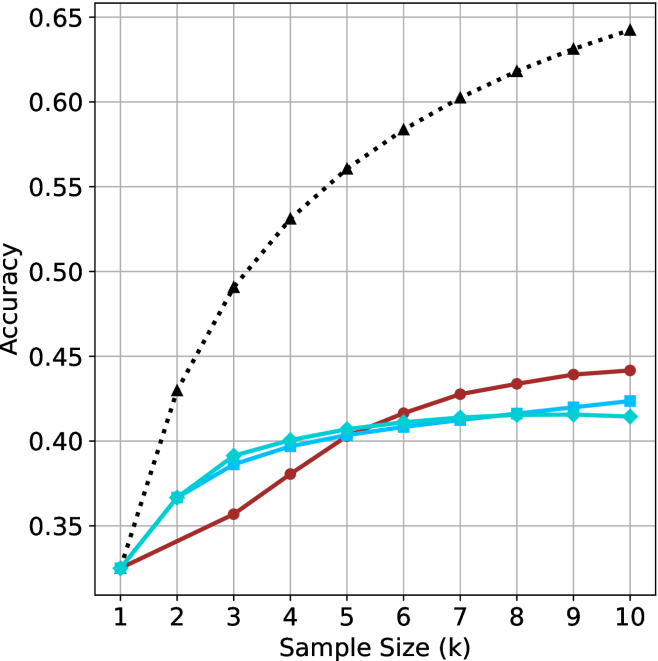
The image presents a line chart illustrating the relationship between sample size (in thousands, denoted as 'k') and accuracy. Three distinct data series are plotted, each represented by a different colored line. The chart appears to demonstrate how accuracy changes as the sample size increases for each series.
### Components/Axes
* **X-axis:** Labeled "Sample Size (k)". The scale ranges from 1 to 10, with increments of 1.
* **Y-axis:** Labeled "Accuracy". The scale ranges from 0.30 to 0.65, with increments of 0.05.
* **Data Series 1:** Represented by a black dotted line.
* **Data Series 2:** Represented by a red solid line.
* **Data Series 3:** Represented by a cyan solid line.
* **Gridlines:** A grid of horizontal and vertical lines is present to aid in reading values.
### Detailed Analysis
**Data Series 1 (Black Dotted Line):** This line exhibits a strong upward trend, starting at approximately 0.33 at a sample size of 1 and reaching approximately 0.64 at a sample size of 10.
* Sample Size 1: Accuracy ≈ 0.33
* Sample Size 2: Accuracy ≈ 0.44
* Sample Size 3: Accuracy ≈ 0.50
* Sample Size 4: Accuracy ≈ 0.55
* Sample Size 5: Accuracy ≈ 0.58
* Sample Size 6: Accuracy ≈ 0.60
* Sample Size 7: Accuracy ≈ 0.61
* Sample Size 8: Accuracy ≈ 0.62
* Sample Size 9: Accuracy ≈ 0.63
* Sample Size 10: Accuracy ≈ 0.64
**Data Series 2 (Red Solid Line):** This line shows a moderate upward trend, starting at approximately 0.33 at a sample size of 1 and reaching approximately 0.44 at a sample size of 10.
* Sample Size 1: Accuracy ≈ 0.33
* Sample Size 2: Accuracy ≈ 0.36
* Sample Size 3: Accuracy ≈ 0.38
* Sample Size 4: Accuracy ≈ 0.40
* Sample Size 5: Accuracy ≈ 0.41
* Sample Size 6: Accuracy ≈ 0.42
* Sample Size 7: Accuracy ≈ 0.42
* Sample Size 8: Accuracy ≈ 0.43
* Sample Size 9: Accuracy ≈ 0.43
* Sample Size 10: Accuracy ≈ 0.44
**Data Series 3 (Cyan Solid Line):** This line demonstrates a gradual upward trend, starting at approximately 0.33 at a sample size of 1 and reaching approximately 0.41 at a sample size of 10.
* Sample Size 1: Accuracy ≈ 0.33
* Sample Size 2: Accuracy ≈ 0.35
* Sample Size 3: Accuracy ≈ 0.37
* Sample Size 4: Accuracy ≈ 0.39
* Sample Size 5: Accuracy ≈ 0.40
* Sample Size 6: Accuracy ≈ 0.40
* Sample Size 7: Accuracy ≈ 0.41
* Sample Size 8: Accuracy ≈ 0.41
* Sample Size 9: Accuracy ≈ 0.41
* Sample Size 10: Accuracy ≈ 0.41
### Key Observations
* Data Series 1 consistently exhibits the highest accuracy across all sample sizes.
* The rate of accuracy improvement diminishes as the sample size increases for all three series.
* Data Series 3 shows the slowest rate of accuracy improvement.
* All three series start with the same accuracy at a sample size of 1.
### Interpretation
The chart suggests that increasing the sample size generally leads to improved accuracy for all three data series. However, the extent of this improvement varies significantly. Data Series 1 demonstrates a much stronger correlation between sample size and accuracy than the other two series. This could indicate that the method or model represented by Data Series 1 benefits more from larger sample sizes. The diminishing returns observed as sample size increases suggest that there is a point beyond which adding more data provides only marginal improvements in accuracy. The initial identical accuracy values suggest a common starting point or baseline for all three methods before diverging with increasing sample size. This data could be used to inform decisions about optimal sample size selection for a given application, balancing the cost of data acquisition with the desired level of accuracy.