## Chart: LM Loss vs. PFLOP/s-days
### Overview
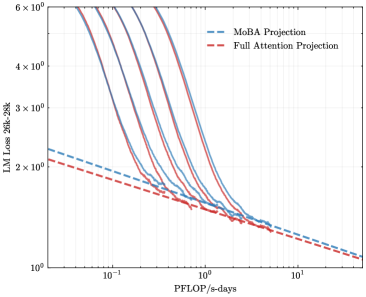
The image is a line chart comparing the Language Model (LM) Loss of "MoBA Projection" and "Full Attention Projection" models against the computational cost measured in PFLOP/s-days. The chart displays multiple runs or configurations for the MoBA Projection, showing a range of performance.
### Components/Axes
* **X-axis:** PFLOP/s-days (PetaFLOPS per second-days), ranging from approximately 0.05 to 10. The axis is displayed on a log scale.
* **Y-axis:** LM Loss 26k-28k, ranging from 1 x 10^0 to 6 x 10^0. The axis is displayed on a log scale.
* **Legend:** Located in the top-right corner:
* Blue dashed line: MoBA Projection
* Red dashed line: Full Attention Projection
### Detailed Analysis
* **MoBA Projection (Blue Lines):** There are multiple blue lines, indicating several runs or configurations of the MoBA Projection model.
* **Trend:** All MoBA Projection lines show a decreasing trend in LM Loss as PFLOP/s-days increase. The lines start with a steep decline, which gradually flattens out as PFLOP/s-days increases.
* **Values:**
* At 0.1 PFLOP/s-days, the LM Loss ranges from approximately 3.5 x 10^0 to 5.5 x 10^0 across the different MoBA runs.
* At 1 PFLOP/s-days, the LM Loss ranges from approximately 1.5 x 10^0 to 2.0 x 10^0.
* At 10 PFLOP/s-days, the LM Loss converges to approximately 1.2 x 10^0 for all MoBA runs.
* **Full Attention Projection (Red Dashed Line):**
* **Trend:** The Full Attention Projection line also shows a decreasing trend in LM Loss as PFLOP/s-days increase, but the decrease is more gradual compared to the MoBA Projection lines.
* **Values:**
* At 0.1 PFLOP/s-days, the LM Loss is approximately 2.2 x 10^0.
* At 1 PFLOP/s-days, the LM Loss is approximately 1.5 x 10^0.
* At 10 PFLOP/s-days, the LM Loss is approximately 1.1 x 10^0.
### Key Observations
* The MoBA Projection model, in its various runs, generally achieves lower LM Loss than the Full Attention Projection model for a given computational cost (PFLOP/s-days), especially at lower computational costs.
* The MoBA Projection lines converge to a similar LM Loss value at higher PFLOP/s-days, suggesting a performance limit or saturation point.
* The Full Attention Projection model shows a more consistent, but less rapid, decrease in LM Loss as computational cost increases.
### Interpretation
The chart suggests that the MoBA Projection model is more efficient in reducing LM Loss compared to the Full Attention Projection model, particularly in the lower computational cost range. The multiple runs of the MoBA Projection model indicate that its performance can vary depending on the specific configuration or initialization. However, at higher computational costs, the performance of the MoBA Projection model converges, indicating a potential limit to its effectiveness. The Full Attention Projection model, while less efficient initially, provides a more consistent and predictable reduction in LM Loss as computational cost increases. The data implies that the choice between MoBA and Full Attention Projection depends on the desired trade-off between initial efficiency and consistent performance at higher computational costs.