## Chart: LM Loss vs. PFLOP/s-days
### Overview
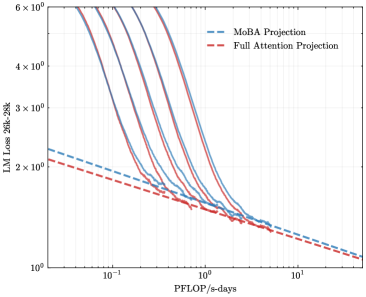
The image presents a line chart comparing the Language Model (LM) Loss for two projection methods: MoBA Projection and Full Attention Projection, plotted against PFLOP/s-days (floating point operations per second per day). Multiple lines are shown for each projection method, likely representing different runs or configurations. The chart uses a logarithmic scale for both the y-axis (LM Loss) and the x-axis (PFLOP/s-days).
### Components/Axes
* **X-axis:** PFLOP/s-days, ranging from approximately 10<sup>-1</sup> to 10<sup>1</sup> (0.1 to 10).
* **Y-axis:** LM Loss 26k-28k, ranging from approximately 10<sup>0</sup> to 6 x 10<sup>6</sup> (1 to 6,000,000). The axis label indicates the loss is calculated for a model size of 26k-28k parameters.
* **Legend:** Located in the top-right corner.
* MoBA Projection (Blue dashed lines)
* Full Attention Projection (Red solid lines)
* **Gridlines:** Present on a logarithmic scale for both axes, aiding in value estimation.
### Detailed Analysis
**MoBA Projection (Blue dashed lines):**
There are approximately 6 blue dashed lines. The trend for all MoBA lines is a steep downward slope initially, flattening out as PFLOP/s-days increase.
* Line 1: Starts at approximately LM Loss = 2 x 10<sup>6</sup> at PFLOP/s-days = 10<sup>-1</sup>, decreasing to approximately LM Loss = 2 x 10<sup>1</sup> at PFLOP/s-days = 10<sup>1</sup>.
* Line 2: Starts at approximately LM Loss = 5 x 10<sup>5</sup> at PFLOP/s-days = 10<sup>-1</sup>, decreasing to approximately LM Loss = 3 x 10<sup>1</sup> at PFLOP/s-days = 10<sup>1</sup>.
* Line 3: Starts at approximately LM Loss = 3 x 10<sup>5</sup> at PFLOP/s-days = 10<sup>-1</sup>, decreasing to approximately LM Loss = 2 x 10<sup>1</sup> at PFLOP/s-days = 10<sup>1</sup>.
* Line 4: Starts at approximately LM Loss = 6 x 10<sup>5</sup> at PFLOP/s-days = 10<sup>-1</sup>, decreasing to approximately LM Loss = 3 x 10<sup>1</sup> at PFLOP/s-days = 10<sup>1</sup>.
* Line 5: Starts at approximately LM Loss = 4 x 10<sup>5</sup> at PFLOP/s-days = 10<sup>-1</sup>, decreasing to approximately LM Loss = 2 x 10<sup>1</sup> at PFLOP/s-days = 10<sup>1</sup>.
* Line 6: Starts at approximately LM Loss = 3 x 10<sup>5</sup> at PFLOP/s-days = 10<sup>-1</sup>, decreasing to approximately LM Loss = 2 x 10<sup>1</sup> at PFLOP/s-days = 10<sup>1</sup>.
**Full Attention Projection (Red solid lines):**
There are approximately 6 red solid lines. The trend for all Full Attention lines is also a steep downward slope initially, flattening out as PFLOP/s-days increase, but generally remaining at a lower LM Loss than the MoBA Projection lines.
* Line 1: Starts at approximately LM Loss = 1 x 10<sup>6</sup> at PFLOP/s-days = 10<sup>-1</sup>, decreasing to approximately LM Loss = 1 x 10<sup>1</sup> at PFLOP/s-days = 10<sup>1</sup>.
* Line 2: Starts at approximately LM Loss = 4 x 10<sup>5</sup> at PFLOP/s-days = 10<sup>-1</sup>, decreasing to approximately LM Loss = 1 x 10<sup>1</sup> at PFLOP/s-days = 10<sup>1</sup>.
* Line 3: Starts at approximately LM Loss = 3 x 10<sup>5</sup> at PFLOP/s-days = 10<sup>-1</sup>, decreasing to approximately LM Loss = 1 x 10<sup>1</sup> at PFLOP/s-days = 10<sup>1</sup>.
* Line 4: Starts at approximately LM Loss = 5 x 10<sup>5</sup> at PFLOP/s-days = 10<sup>-1</sup>, decreasing to approximately LM Loss = 1 x 10<sup>1</sup> at PFLOP/s-days = 10<sup>1</sup>.
* Line 5: Starts at approximately LM Loss = 3 x 10<sup>5</sup> at PFLOP/s-days = 10<sup>-1</sup>, decreasing to approximately LM Loss = 1 x 10<sup>1</sup> at PFLOP/s-days = 10<sup>1</sup>.
* Line 6: Starts at approximately LM Loss = 2 x 10<sup>5</sup> at PFLOP/s-days = 10<sup>-1</sup>, decreasing to approximately LM Loss = 1 x 10<sup>1</sup> at PFLOP/s-days = 10<sup>1</sup>.
### Key Observations
* Full Attention Projection consistently achieves lower LM Loss values than MoBA Projection across the entire range of PFLOP/s-days.
* The rate of loss reduction diminishes as PFLOP/s-days increase for both methods.
* There is variability in performance within each method, as indicated by the multiple lines. This suggests that factors beyond just the projection method influence the LM Loss.
### Interpretation
The chart demonstrates the trade-off between computational cost (PFLOP/s-days) and model performance (LM Loss). Full Attention Projection appears to be more efficient in achieving lower loss for a given computational budget compared to MoBA Projection. The multiple lines for each method suggest that the performance is not deterministic and is likely influenced by factors such as initialization, data distribution, or hyperparameter settings. The diminishing returns in loss reduction at higher PFLOP/s-days indicate that there is a point of diminishing returns where increasing computational cost yields only marginal improvements in model performance. This information is valuable for optimizing the training process of language models, allowing for informed decisions about the allocation of computational resources. The model size of 26k-28k parameters is a key parameter to consider when interpreting these results, as the optimal trade-off between cost and performance may vary for different model sizes.