## Line Chart: GPT and Claude Performance vs. Top K Retrieved Knowledge
### Overview
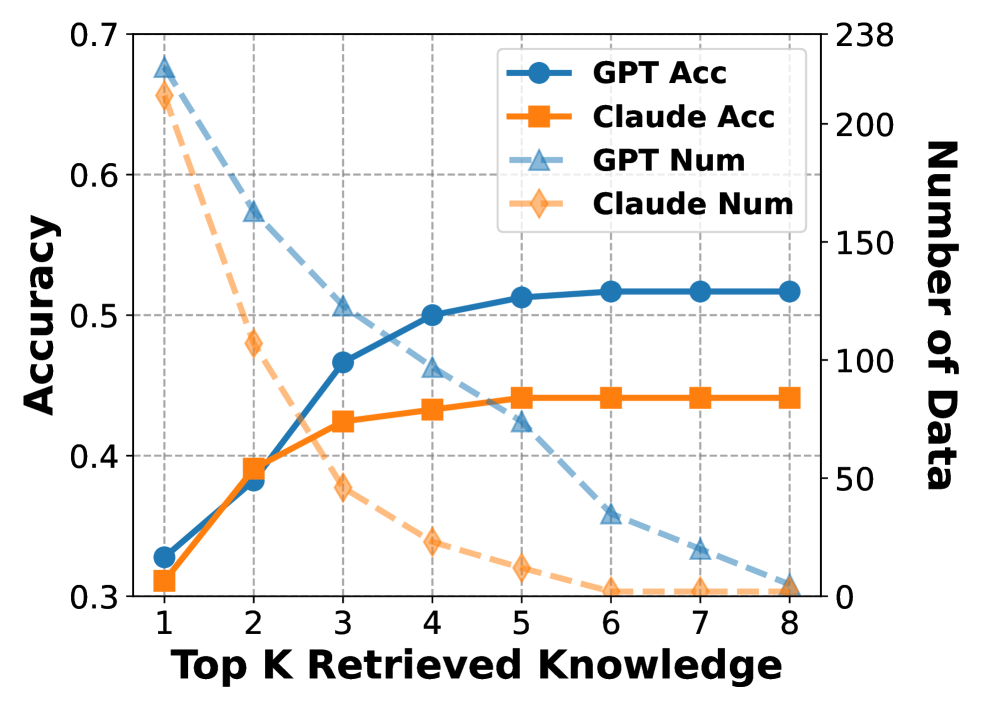
The image is a line chart comparing the performance of GPT and Claude models based on "Top K Retrieved Knowledge." The chart displays two metrics: "Accuracy" (left y-axis) and "Number of Data" (right y-axis), plotted against "Top K Retrieved Knowledge" (x-axis). There are four data series in total: GPT Accuracy, Claude Accuracy, GPT Number of Data, and Claude Number of Data.
### Components/Axes
* **X-axis:** "Top K Retrieved Knowledge" ranging from 1 to 8.
* **Left Y-axis:** "Accuracy" ranging from 0.3 to 0.7, with gridlines at intervals of 0.1.
* **Right Y-axis:** "Number of Data" ranging from 0 to 238, with gridlines at intervals of approximately 50.
* **Legend (Top-Right):**
* Blue circle marker, solid line: "GPT Acc"
* Orange square marker, solid line: "Claude Acc"
* Light blue triangle marker, dashed line: "GPT Num"
* Light orange diamond marker, dashed line: "Claude Num"
### Detailed Analysis
* **GPT Acc (Blue, Solid Line):** The accuracy of GPT increases as the Top K Retrieved Knowledge increases.
* K=1: Accuracy ≈ 0.32
* K=2: Accuracy ≈ 0.39
* K=3: Accuracy ≈ 0.47
* K=4: Accuracy ≈ 0.50
* K=5: Accuracy ≈ 0.51
* K=6: Accuracy ≈ 0.52
* K=7: Accuracy ≈ 0.52
* K=8: Accuracy ≈ 0.52
* **Claude Acc (Orange, Solid Line):** The accuracy of Claude also increases with Top K Retrieved Knowledge, but plateaus earlier than GPT.
* K=1: Accuracy ≈ 0.31
* K=2: Accuracy ≈ 0.39
* K=3: Accuracy ≈ 0.43
* K=4: Accuracy ≈ 0.44
* K=5: Accuracy ≈ 0.44
* K=6: Accuracy ≈ 0.44
* K=7: Accuracy ≈ 0.44
* K=8: Accuracy ≈ 0.44
* **GPT Num (Light Blue, Dashed Line):** The number of data points for GPT decreases as Top K Retrieved Knowledge increases.
* K=1: Number of Data ≈ 225
* K=2: Number of Data ≈ 150
* K=3: Number of Data ≈ 90
* K=4: Number of Data ≈ 70
* K=5: Number of Data ≈ 60
* K=6: Number of Data ≈ 25
* K=7: Number of Data ≈ 15
* K=8: Number of Data ≈ 10
* **Claude Num (Light Orange, Dashed Line):** The number of data points for Claude also decreases as Top K Retrieved Knowledge increases.
* K=1: Number of Data ≈ 210
* K=2: Number of Data ≈ 80
* K=3: Number of Data ≈ 40
* K=4: Number of Data ≈ 30
* K=5: Number of Data ≈ 20
* K=6: Number of Data ≈ 15
* K=7: Number of Data ≈ 10
* K=8: Number of Data ≈ 5
### Key Observations
* GPT accuracy consistently outperforms Claude accuracy as K increases beyond 2.
* The number of data points decreases for both models as K increases.
* GPT's accuracy continues to increase slightly even after Claude's accuracy plateaus.
* The number of data points for GPT is slightly higher than Claude for K values greater than 4.
### Interpretation
The chart suggests that increasing the "Top K Retrieved Knowledge" initially improves the accuracy of both GPT and Claude models. However, the number of data points used to calculate the accuracy decreases as K increases. This could indicate that while the models are leveraging more knowledge, they are doing so on a smaller and potentially more selective dataset. GPT appears to benefit more from higher K values, achieving better accuracy than Claude, even though the number of data points is decreasing. The plateau in Claude's accuracy suggests a limit to how much it can benefit from additional retrieved knowledge, or perhaps a diminishing return given the decreasing data size. The relationship between accuracy and the number of data points is crucial; a high accuracy based on very few data points might not be as reliable as a slightly lower accuracy based on a larger dataset.